Introduction to Nuclear Reactor Operations
By
Reed Robert Burn
December 1988
Transcriber’s note: handwritten name in lower right corner of cover, not transcribed
NUCLEAR SIMULATION / THE READING ROOM
Introduction to Nuclear Reactor Operations
Help me check the transcription. Highlight a passage, then choose Comment on highlight to flag a possible mistake or ask a question. Use Show original scan on any page to compare it with the source.
Comments are public and visible to me and other readers. You can browse all feedback using Reader comments.
Loading reader highlights…
This copy preserves the supplied transcription, including the book’s original notation and errors. Equations and tables remain typed; diagrams retain their scan images. Source-page numbers refer to the 304-page original binder.
The four-line running header that the original repeats on every page (INTRODUCTION TO NUCLEAR REACTOR OPERATIONS / chapter name / Reed Robert Burn / December 1988) and the "Page x-y" footer are not retyped on each page; they are represented by the small label strip at the top of every section. Equations, worked calculations, tables and the contents pages are typed in a fixed-width block so that their alignment is kept. Subscripts and superscripts are typed exactly as the original prints them, which means the original's own inconsistencies (for example T2 in one line and T2 in the next) are kept. The typewriter's slashed-o flux symbol is shown as φ, and its raised-circle zero as a superscript 0. Graphs, diagrams and drawings cannot be "typed"; they are shown as cleaned image cuttings from the scan, with their captions typed. Tables, including the small-print reproduced tables, are typed in full.
A few spots are physically unreadable in the scan (clipped at a page edge, faded or smudged); each is marked [illegible] and explained in a highlighted transcriber's note on that page, and nothing has been guessed silently. The button "Show original scan" on every page displays the scanned page for comparison. The companion file RRBurn_Reader.html shows the original scan of every page beside the typed text, and has search. Printed page 2-1 does not exist in the scanned binder: source page 039 ends at printed 1-29 and source page 040 begins at printed 2-2; no text has been supplied from elsewhere.
Use the bar at the top to change the text size, switch between serif and sans-serif type, cycle the light / sepia / dark themes, jump to a source page number, or search the whole book. The Contents button opens the chapter and section list. Settings are remembered on this computer.
Introduction to Nuclear Reactor Operations
By
Reed Robert Burn
December 1988
This page of the original is blank apart from its running header and page label.
Introduction to Nuclear Reactor Operations
By
Reed Robert Burn
December 1988
This page of the original is blank apart from its running header and page label.
                             CONTENTS
                                                            Page

CHAPTER 1     MATHEMATICS OF REACTOR OPERATIONS

1.1   Introduction                                          1-1

      1.1.1   Objectives                                    1-1

1.2   Arithmetic Operations                                 1-1

      1.2.1   Dimensional Analysis and
              Unit Consistency                              1-1
      1.2.2   Problem Solving Techniques                    1-2
      1.2.3   Exponents and Roots                           1-2
      1.2.4   Logarithms                                    1-3
      1.2.5   Ratio and Proportion                          1-4

1.3   Algebra                                               1-4

      1.3.1   Factoring                                     1-4
      1.3.2   Simultaneous Equations                        1-5
      1.3.3   Equivalent Equations                          1-6
      1.3.4   Weighted Fractions and Averages               1-7
      1.3.5   Statistics                                    1-8

1.4   Geometry                                              1-9

      1.4.1   Perimeters, Areas, and Volumes                1-9
      1.4.2   Right Triangle                                1-9
      1.4.3   Coordinate Systems                            1-10
      1.4.4   Graphic Representations                       1-10

1.5   Trigonometry                                          1-15

      1.5.1   Trigonometric Functions                       1-15

1.6   Calculus                                              1-17

      1.6.1   Infinite Series                               1-17
      1.6.2   Differentiation and Integration               1-18
      1.6.3   Differential Equations                        1-18

1.7   Problems                                              1-22

CHAPTER 2     NUCLEAR REACTOR PHYSICS

2.1   Introduction                                          2-1

      2.1.1   Objectives                                    2-1
2.2   Fundamental Particles                                 2-1

      2.2.1   Electron (Beta Particle)                      2-2
      2.2.2   Proton                                        2-2
      2.2.3   Neutron                                       2-3
      2.2.4   Gamma Ray or Photon                           2-4
      2.2.5   Neutrino                                      2-5
      2.2.6   Alpha                                         2-5

2.3   The Atom and the Atomic Nucleus                       2-5

      2.3.1   Molecules                                     2-6
      2.3.2   Gram Atomic Weight, Gram Molecular Weight,
              and Avogadro's Number                         2-7
      2.3.3   Atomic and Nuclear Radii                      2-8
      2.3.4   Mass and Energy                               2-10
      2.3.5   Density, Number Density, Weight Fraction,
              Atom Fraction, and Volume Fraction            2-14

2.4   Interactions of Radiation with Matter                 2-19

      2.4.1   Gamma Ray Interactions                        2-19
      2.4.2   Alpha Particle Interactions                   2-24
      2.4.3   Beta Interactions                             2-24
      2.4.4   Fission Fragment Interactions                 2-26
      2.4.5   Neutron Interactions                          2-26
      2.4.6   Radioactivity and Radioactive Decay           2-30

2.5   Cross Sections                                        2-36

      2.5.1   Microscopic Cross Section                     2-36
      2.5.2   Macroscopic Cross Section                     2-43
      2.5.3   Neutron Moderation                            2-45

2.6   Reaction Rate                                         2-47

      2.6.1   Neutron Flux                                  2-47
      2.6.2   Reaction Rate                                 2-50
      2.6.3   Neutron Activation                            2-52

2.7   Properties of Elements and Reactor Materials          2-57

2.8   Problems                                              2-60

CHAPTER 3  NUCLEAR FISSION AND NEUTRON MULTIPLICATION

3.1   Introduction                                          3-1

      3.1.1   Objectives                                    3-1
3.2   Nuclear Fission                                       3-2

      3.2.1   Fission Products and Energy Release           3-4
      3.2.2   Delayed Neutrons                              3-7
      3.2.3   Delayed Neutron Fraction in a Mixed
              Fuel Core                                     3-11
      3.2.4   Effective Delayed Neutron Fraction, βeff      3-13

3.3   The Chain Reaction, Neutron Multiplication,
      Reactivity, and the Six Factor Formula                3-13

      3.3.1   Neutron Multiplication                        3-16
      3.3.2   Factors Affecting Neutron Multiplication      3-18
      3.3.3   Criticality                                   3-20
      3.3.4   Reactivity                                    3-20
      3.3.5   Neutron Lifetime                              3-23
      3.3.6   Prompt Generation Time                        3-24
      3.3.7   Delayed Generation Time                       3-27

3.4   Problems                                              3-32

CHAPTER 4  REACTOR KINETICS

4.1   Introduction                                          4-1

      4.1.1   Objectives                                    4-1

4.2   Prompt Critical Reactor                               4-1

4.3   Reactor Period and Reactor Power                      4-4

4.4   Delayed Critical Reactor                              4-8

      4.4.1   Transient Reactor Period                      4-11

4.5   Reactor Shutdown                                      4-12

4.6   Limits on Positive and Negative Periods               4-16

4.7   Prompt Jump and Drop                                  4-21

4.8   Source Criticality                                    4-23

4.9   Decay Heat Power                                      4-23

4.10  Problems                                              4-27
CHAPTER 5  SUBCRITICAL MULTIPLICATION

5.1   Introduction                                          5-1

      5.1.1   Objectives                                    5-1

5.2   Neutron Sources                                       5-1

      5.2.1   Natural Neutron Sources                       5-2
      5.2.2   Installed Neutron Sources                     5-2

5.3   Neutron Multiplication in a Subcritical Reactor       5-5

5.4   Inverse Multiplication                                5-14

5.5   Critical Loading Experiment                           5-18

5.6   Neutron Source Addition to a Reactor                  5-25

5.7   Problems                                              5-28

CHAPTER 6  REACTIVITY CONTROL, KINETICS, AND COEFFICIENTS

6.1   Introduction                                          6-1

      6.1.1   Objectives                                    6-1

6.2   Reactivity Control and Kinetics                       6-1

      6.2.1   Kex, Excess Multiplication Factor             6-2
      6.2.2   pex, Excess Reactivity                        6-2
      6.2.3   SDM, Shutdown Margin                          6-4

6.4   Reactivity Coefficients                               6-4

      6.4.1   Moderator Temperature Coefficient             6-5
              6.4.1.1   Moderator to Fuel Ratio             6-7
              6.4.1.2   Undermoderation and
                        Overmoderation                      6-10
      6.4.2   Void Coefficient                              6-12

6.5   Problems                                              6-14

CHAPTER 7  CONTROL RODS

7.1   Introduction                                          7-1

      7.1.1   Objectives                                    7-1

7.2   Differential Rod Worth                                7-1

7.3   Integral Rod Worth                                    7-5
7.4   Rod Worth Limits and Reactivity Insertion Rates       7-10

7.5   Rod Shadow                                            7-12

7.6   Factors Affecting Rod Shadow                          7-15

7.7   Problems                                              7-16

CHAPTER 8  FISSION PRODUCT POISONS

8.1   Introduction                                          8-1

      8.1.1   Objectives                                    8-1

8.2   Xenon Balance in the Reactor                          8-3

8.3   Xenon Equilibrium                                     8-7

8.4   Xenon Transient Behavior                              8-9

      8.4.1   Reactor Shutdown                              8-9
      8.4.2   Reactor Startup Following Shutdown            8-10
      8.4.3   Power Transients                              8-13

8.5   Samarium Balance in the Reactor                       8-15

8.6   Samarium Equilibrium                                  8-15

8.7   Samarium Transient Behavior                           8-17

      8.7.1   Reactor Shutdown                              8-17
      8.7.2   Reactor Startup Following Shutdown            8-19
      8.7.3   Power Transients                              8-19

8.8   Problems                                              8-23
CHAPTER 9  REACTOR CORE ANALYSIS

9.1   Introduction                                          9-1

      9.1.1   Objectives                                    9-1

9.2   Core Flux Profiles                                    9-1

9.3   Reactor Criticality                                   9-7

9.4   Operating Flux                                        9-8

9.5   Core Temperature Profiles                             9-12

9.6   Problems                                              9-15

APPENDIX A  EQUATIONS, DATA, AND CONVERSION FACTORS

A.1  Reactor Theory Equations                        Appendix-3
This chapter is intended to provide a brief review of mathematics as applied to reactor operations. Examples are specifically applicable to the subsequent text. A minimum of explanation is provided since it is assumed the student has had previous exposure to the material.
After studying the lesson material and working exercise problems, the student should be able to:
1. Solve problems involving dimensional analysis and unit consistency, fractions; exponents and roots, logarithms, ratio and proportion, factoring, simultaneous equations, equivalent equations, weighted fractions, averages, statistics, perimeters, areas, volumes, right triangles, coordinate systems, graphic representations, and basic trigonometric functions.
2. Apply solutions to first order linear differential equations to power level determination, radioactive decay, and radiation shielding.
Many problems in science and engineering can be solved by inspection of the units that the answer will take, that is, by a logical arrangement of the given data. Dimensional analysis is a simple method used to solve many problems: by looking at the units of the given information or of a conversion factor and the required units of the desired answer, the method of solution becomes obvious. For example, the equation for conductive heat flow is:
Q = UAΔT (1.1)
The units on the variables are Q Btu/hr, A ft2, and ΔT F. The units on the overall heat transfer coefficient can be implied by dimensional analysis as U Btu/hr ft2 F.
In addition, consistency between units is necessary in solving problems to arrive at the correct answer. The following equations illustrate unit consistency.
P = P0et/T      t = seconds          T = seconds          (1.2)

A = A0e-.693t/T2   t = seconds      T2 = seconds         (1.3)

                     t = minutes      T2 = minutes

                     t = hours        T2 = hours

                     t = years        T2 = years

I = I0e-2.3x/x10   x = centimeters  x10 = centimeters   (1.4)

                     x = inches       x10 = inches

                     x = feet         x10 = feet
Most common mathematical manipulations involve fractions divided by fractions which must be simplified. In the equation for inverse multiplication,
1/M = (S/1-K0)/(S/1-Kn) (1.5)
both the numerator and denominator are fractions. These can be simplified with proper multiplication by ratios whose values are one. In equation (1.5), the ratio can be multiplied by (1/S)/(1/S) and by (1-Kn)/(1-Kn), both of which equal one so the value does not change.
1/M=(s/1-K0)/(S/1-Kn) . (1/S)/(1/S) . (1-Kn)/(1-Kn)

   =(1-Kn)/(1-K0)                                             (1.6)
A general rule for such manipulations is:
(A/B)/(C/D) = AD/BC (1.7)
Manipulation of exponents is most easily illustrated by several examples.
eaeb = ea+b                                                    (1.8)

(ea)b = eab                                                    (1.9)
e-a = 1/ea                                                     (1.10)

e1/2 = √e                                                      (1.11)

e0 = A0 = 1                                                    (1.12)

(5x10²)+(4x10⁴)+(2x10⁶)                                         (1.13)

          = (2+.04+.0005)x106

          = 2.0405x10⁶

(4x10²)/(2x10-3) = (4x102x103)/2                                (1.14)

                   = (4x10⁵)/2

                   = 2x10⁵

(2x10⁴)3 = 8x10¹²                                                 (1.15)

(27x109)1/3 = 3√27x109 = 3x10³                                  (1.16)
Any number can be approximated as a logarithmic base raised to an exponential power.
Exponential expression:  number = (base)exponent

Logarithmic expression:  logbase(number) = exponent
The most common bases in reactor operations are 10 and e (2.72). Often the logarithm using 10 as the base is expressed as log and the logarithm using e as the base as ln or natural logarithm.
                    Base 10                       Base e
Number      10exponent         log       eexponent          ln

   1        100              0       e0                0
   2        10.301            .301       e.693             .693
   2.72     10.435            .435       e1               1.00
   3        10.477            .477       e1.10            1.10
   4        10.602            .602       e1.39            1.39
   5        10.699            .699       e1.61            1.61
   6        10.778            .778       e1.79            1.79
   7        10.845            .845       e1.95            1.95
   8        10.903            .903       e2.08            2.08
   9        10.954            .954       e2.20            2.20
  10        101                1       e2.30            2.30
 100        102                2       e4.60            4.60
1000        103                3       e6.91            6.91
If two properties are linearly proportional and one set of values is known, then any other set can be calculatd from a known value of one of the parameters. For example, power is linearly dependent upon flux.
P= Σfφ (conversion factors) (1.17)
If power and flux are known at one level, P1 and φ1, the power corresponding to another value of flux, φ2, can be determined by
P2/P1 = φ2/φ1 (1.18)
or
P2 = P1(φ2/φ1).
Ratios can be established between parameters which are not linearly dependent. In radiation the dose rate, D, is proportional to the source strength, S, divided by the surface of a sphere, 4πr2, surrounding a point source at a distance, r, from the source
D = S/4πr2 (1.19)
The ratio of two doses at two distances from a source is
D2/D1 = r12/r22 (1.20)
which is an inverse square ratio as compared to the direct linear ratio in equation (1.18)
The expression for reactor period, T, is
T = (β-ρ)/λρ (1.21)
Since reactivity, ρ, is often desired for a known period, equation (1.21) must be solved for reactivity. Multiply both sides by the same factor, λρ, and the equality remains unchanged.
λρT = β-ρ
Add ρ to both sides to again sustain the equality.
ρ + λρT = β
Factor ρ, from both terms on the left hand side of the equation.
ρ(1+λT) = β
Divide both sides by (1+λT) to arrive at an expression for reactivity.
ρ = β/(1+λT) (1.22)
Another expression for reactivity is the fractional change in neutron population per generation which is:
ρ = (N1-N0)/N1                                                (1.23)

  = (KN0-N0)/KN0
Factor N0 from the numerator.
ρ = N0(K-1)/N0K

  = (K-1)/K                                                    (1.24)
Two equations used to determine steady state xenon poison levels in a reactor core are the equilibrium xenon balance and the equilibrium iodine balance.
γXΣfφ + λII -λXX - XσXφ = 0                                     (1.25)

γIΣfφ - λII = 0                                                 (1.26)
Steady state xenon, X, is determined by simultaneously solving these equations. First solve for λII in equation (1.26).
λII = γIΣfφ
Substitute this expression in equation (1.25).
γXΣfφ + γIΣfφ - λXX - XσXφ = 0
Bring the two terms containing X to one side of the equation.
λXX + XσXφ = γXΣfφ + γIΣfφ
Factor both sides to simplify.
X(λX + σXφ) = (γX + γI)Σfφ
Divide through by (λX + σXφ) to obtain the desired parameter, X.
X = (γX + γI)Σfφ/(λX + σXφ) (1.27)
In a prompt critical reactor, the prompt neutron fraction (1-β) is less than one, so K must be greater than one in order to be prompt critical. The product,
(1-β)K = 1 (1.28)
Solve for K by dividing both sides by (1-β).
K = 1/(1-β) (1.29)
Equation (1.24) expressed reactivity in terms of K. Multiply both sides of (1.24) by K.
Kρ = K-1
Subtract K from both sides of this expression and multiply both sides by -1 which does not change the equality.
-K + Kρ = -1

K - Kρ = 1
Factor K from the left hand side.
K(1-ρ) = 1 (1.30)
Divide both sides by (1-ρ).
K = 1/(1-ρ) = 1/(1-β) (1.31)
By inspection, the form and terms are identical, so in a prompt critical reactor, ρ=β.
A similar equivalence is used to determine shutdown reactor period. The reactor period equation is
P = P0et/T (1.32)
When large negative reactivity is inserted in the core, reactor power decreases by radioactive decay of the longest lived source of delayed neutrons, Br-87, with a 55 second half life which is expressed as
P = P0e-.693t/T2 (1.33)
These two equations are equivalent and can be equated.
P0et/T = P0e-.693t/T2 (1.34)
Divide both sides by P0 and take the natural logarithm (ln) of both sides.
t/T = -.693t/T2
Divide both sides by t and invert.
T = -T2/.693 (1.35)
Substitution of 55 seconds for T2 yields a shutdown period, T = -80 seconds.
In a mixture of two substances, the fraction of one is the portion of one divided by the total of the two. Fractions can be expressed by weight, volume, number of atoms, or any other chosen criterion.
In wet steam, quality is the weight fraction of steam in a steam-water mixture.
Quality
    = (weight steam)/(weight steam + weight water)    (1.36)
Moisture content is the corresponding weight fraction of water in a steam-water mixture.
Moisture Content
    = (weight water)/(weight steam + weight water)    (1.37)
The sum of the two is the fraction of the two constituents in the mixture.
Quality + Moisture Content
    = (weight steam + weight water)/
      (weight steam + weight water)

    = 1
Void fraction in wet steam is the volume fraction of steam in a steam-water mixture, as opposed to weight fraction.
Void Fraction
    = (Volume steam)/(Volume steam + volume water)    (1.38)
Another application of weighted fractions and averages deals with delayed neutrons in a reactor core. Suppose a reactor contained 10,000 neutrons, of which 65 were delayed or the result of fission product decay. The delayed neutron fraction, β, in the core is
Delayed Neutron Fraction = 65/10,000

                         = .0065

                         = β
The remainder, 9935, are prompt or produced directly by fission.
Prompt Neutron Fraction = 9935/10,000

                        = .9935

                        = 1 -.0065

                        = 1-β
The total number of neutrons is 10,000. The total fraction is (1-β) + β = 1.
The generation time of delayed neutrons is relatively long, t = 13 seconds, while that of prompt neutrons is exceedingly short, l* = 1x10⁻⁴ seconds. The core neutron generation time, ld, is the weighted average of the two.
ld = (1-β)l* + βt                                             (1.39)

   = (.9935)(1x10⁻⁴) + (.0065)(13)

   = .0976 seconds
An area in which statistics have application to nuclear power plants is in determining whether the count rate on a detector is changing significantly. A count rate is considered to be changing significantly if it varies by more than a standard deviation, σ, from its previous value. The standard deviation is equal to the square root of the count rate, C.
σ = √ C (1.40)
Consider the following detector count rates.
Count Rate, C     Standard Deviation, σ   Count Rate   Variation
   (cps)                 (cps)              (cps)         (%)

     10                    3                 10±3         10±30%
    100                   10                100±10       100±10%
   1000                   32               1000±32      1000±3%
  10000                  100              10000±100    10000±1%
 100000                  320             100000±320    10000±.3%
As the count rate decreases, the expected statistical variation as calculated by the standard deviation increases as a percentage of the count rate. That is why a recorder trace varies over a wide range at low count rates and is quite steady at high count rates.
In performing a measurement, the greatest accuracy will be obtained by using the highest count rate within the signal processing capacity of the system.
A detector that varies by more than a standard deviation from the average count rate more than 1/3 of the time is probably malfunctioning.
The parameter, π = 3.14, is the ratio of the circumference of a circle to its diameter. It is used extensively in calculations involving circles, spheres, and cylinders.
              Perimeter        Area         Volume

Circle        2πr              πr2
Sphere                         4πr2         4πr3/3
Cylinder                       2πrh         πr2h
Rectangle     2(W+L)           WL           WLT
Triangle                       hb/2
The square of the hypotenuse, h, of a right triangle is equal to the sum of the squares of the two sides, X and Y.
h2 = X2 + Y2 (1.41)
The three major coordinate systems utilized in graphic respresentations are shown in Figure 1.1. The most common is the cartesian system. For three dimensional graphs, XYZ axis are used; in two dimensional representations, X and Y are used.
In the cylindrical representation, the XY plane is replaced by a radius, r, and an angle, θ, representation. The Z axis remains unchanged. In many cases, representation of a point on a cylinder is simplified with cylindrical coordinates because the base XY plane has been converted to circular geometry and the base of a cylinder is a circle.
Similarly, points on spheres are more easily represented in spherical geometry. A point is located by a radius, r, an angle in the XY plane, θ, and a second angle in the Z direction, φ.
Figure 1.2 provides several illustrations of plots of a dependent variable, the vertical axis, versus an independent variable, the horizontal axis. The independent variable is given or assumes a value and the dependent variable follows as a function of the dependent variable.
In Figure 1.2.a, heat flow, Q, is a function of differential temperature, ΔT.
Q = UA ΔT (1.42)
The relationship between Q and ΔT is linear. If ΔT doubles, Q doubles. A linear relationship is represented graphically as a straight line. The slope, which is the ratio of a change in the dependent variable to a change in the independent variable, is constant for a linear relationship. In Figure 1.2.a, two slopes are shown. The left graph has a positive slope, m = ΔQ/ΔT, because an increase in T results in an increase in Q. The right plot has a negative slope. An increase in K produces a decrease in 1/M.
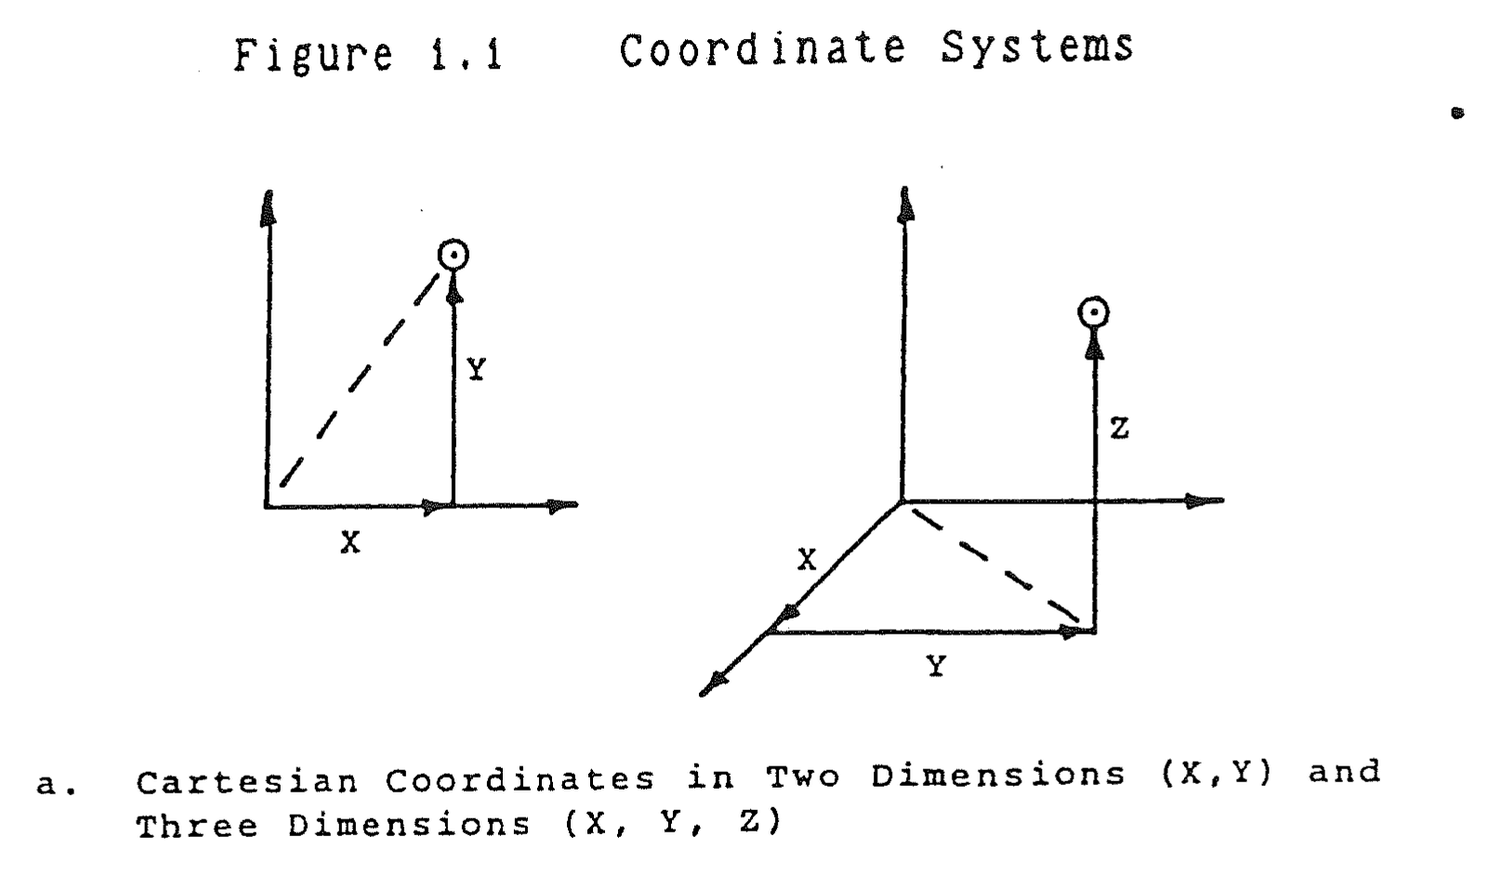


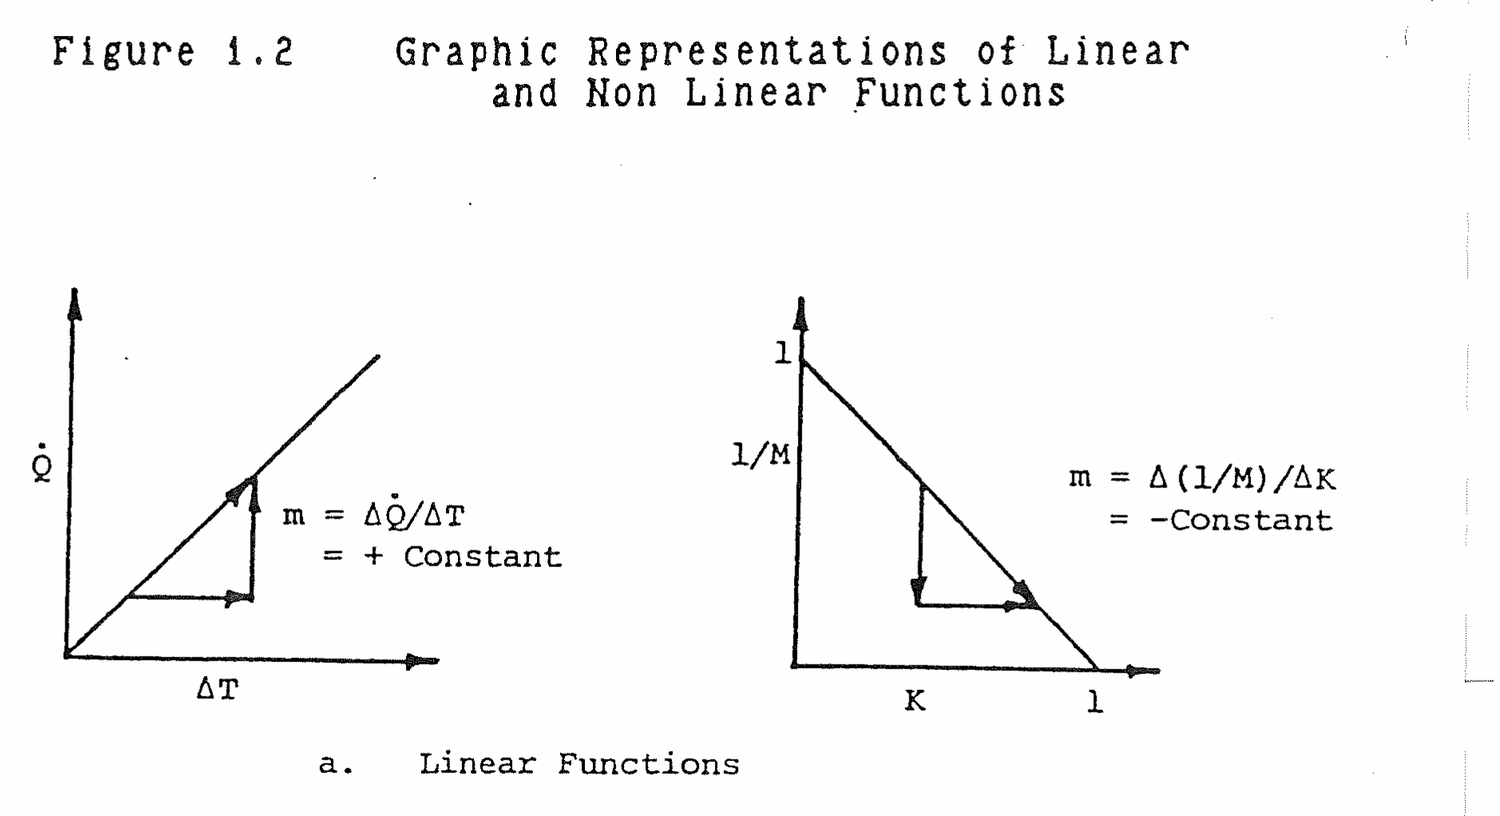
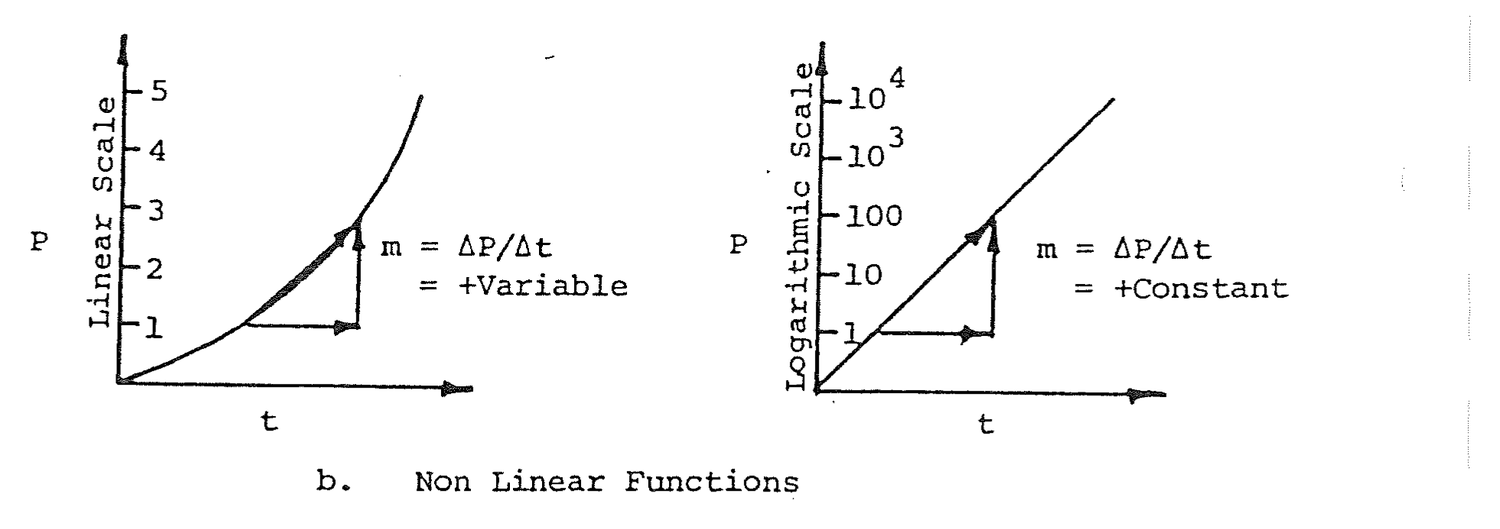
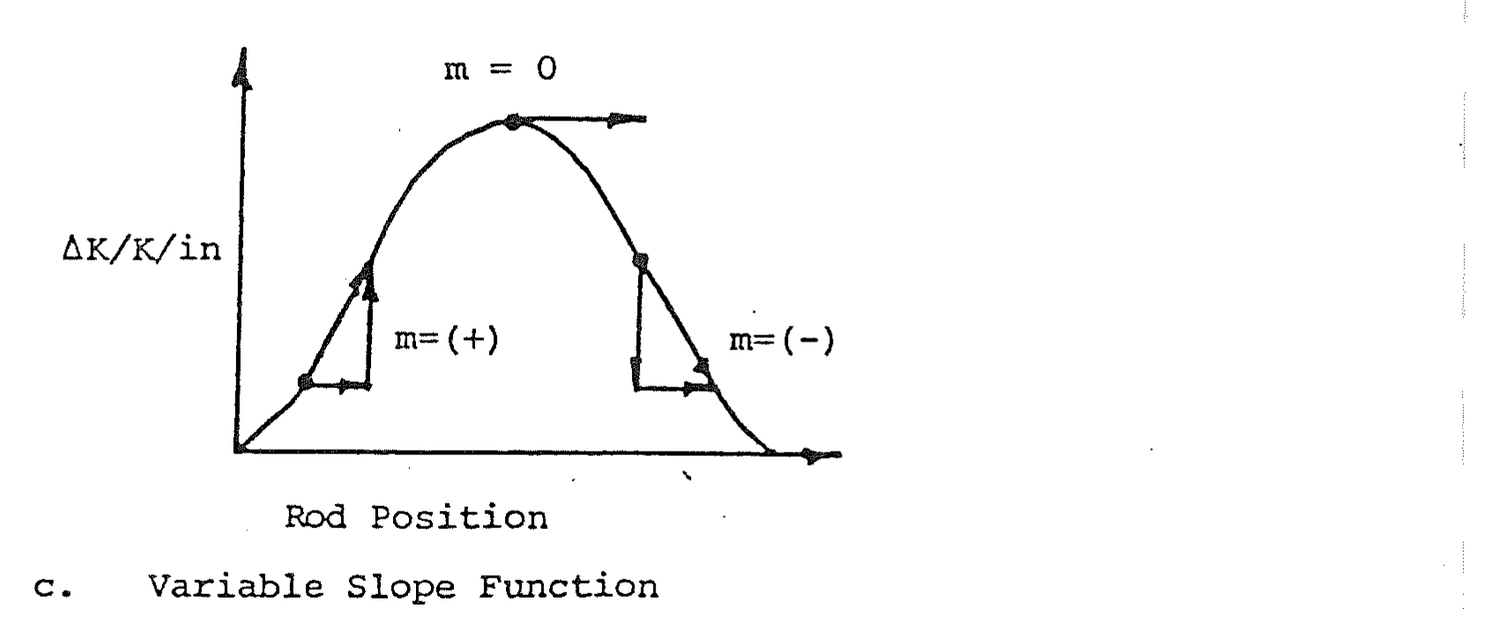
Figure 1.2.b shows the exponential relationship between power, P, and time, t.
P = P0et/T (1.43)
When the dependent variable, P, is plotted on a linear scale, the power is ever increasing with time and the slope is variable. If the vertical axis is made logarithmic, the plot becomes linear because an exponential function, when plotted on a logarithmic scale, is a straight line. This phenomenon is sometimes useful in plotting radioactive decay and shielding attenuation data.
Figure 1.2.c shows a relationship in which the dependent variable changes significantly. The slope ranges from positive to negative. At the apex of the plot, the slope is momentarily zero. This condition, a zero slope, is called equilibrium because the dependent variable does not change as the independent variable changes.
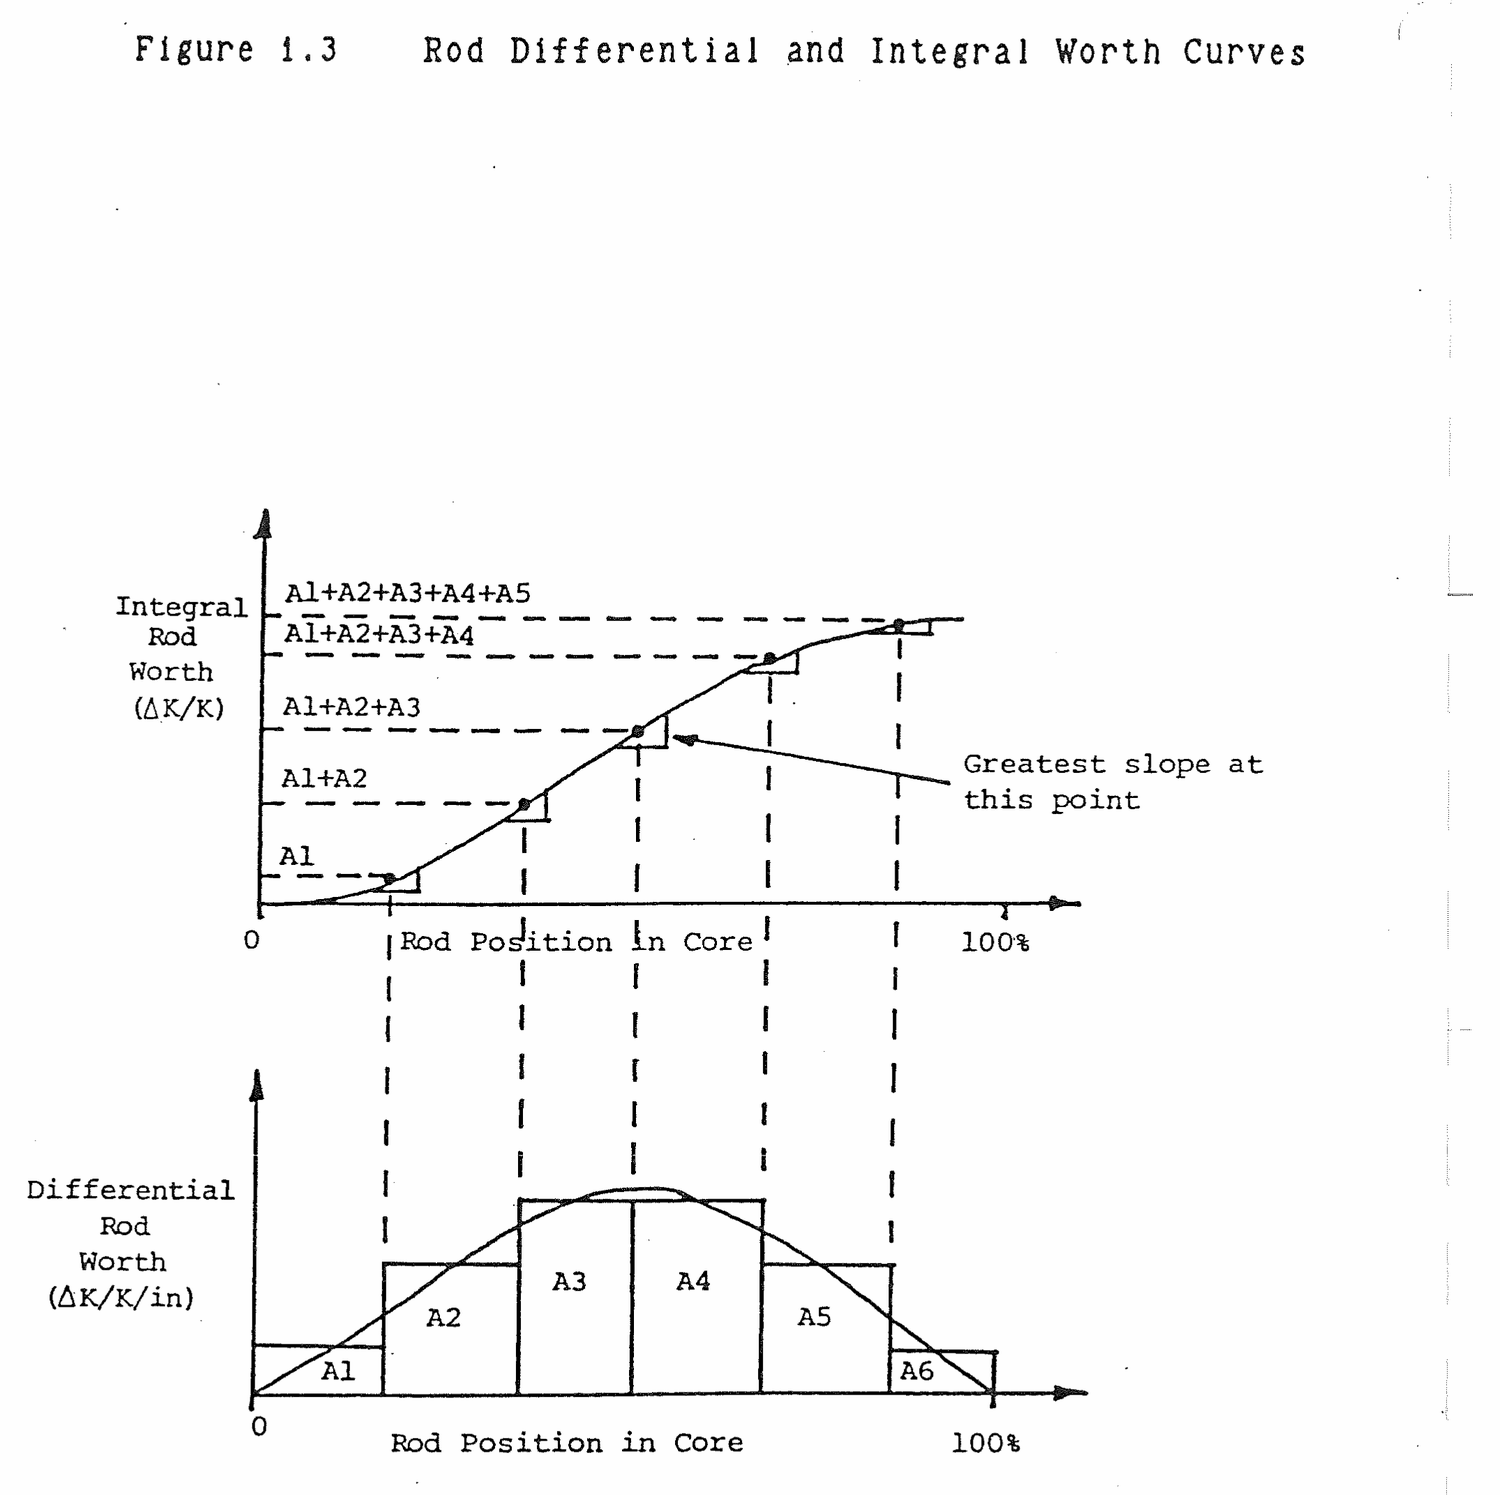
The relationship between two curves is shown in Figure 1.3. The differential rod worth curve is similar to Figure 1.2.c. It provides the rod effect on the reactor per inch of rod motion. Finding the area under the differential rod worth curve can be done by dividing the horizontal axis into segments and approximating the area along each segment as a rectangle. Retangular areas A1 - A6 are such approximations.
The area under the differential curve represents the cumulative effect of withdrawing a control rod a specific amount from the core. The rectangular areas are least at the edges of the core and maximum in the core center where flux is greatest. The integral rod worth curve is a plot of the summed area under the differential curve up to a designated rod position. The value of the integral worth is the cumulative effect of withdrawing a control rod a specific distance from the core.
The slope of the integral curve is least at the ends where each progressive area that is accumulated is small. The slope is the greatest at the center where each successive area is large. The slope is greatest where the curve changes most rapidly, that is, where the next area to be added is largest.
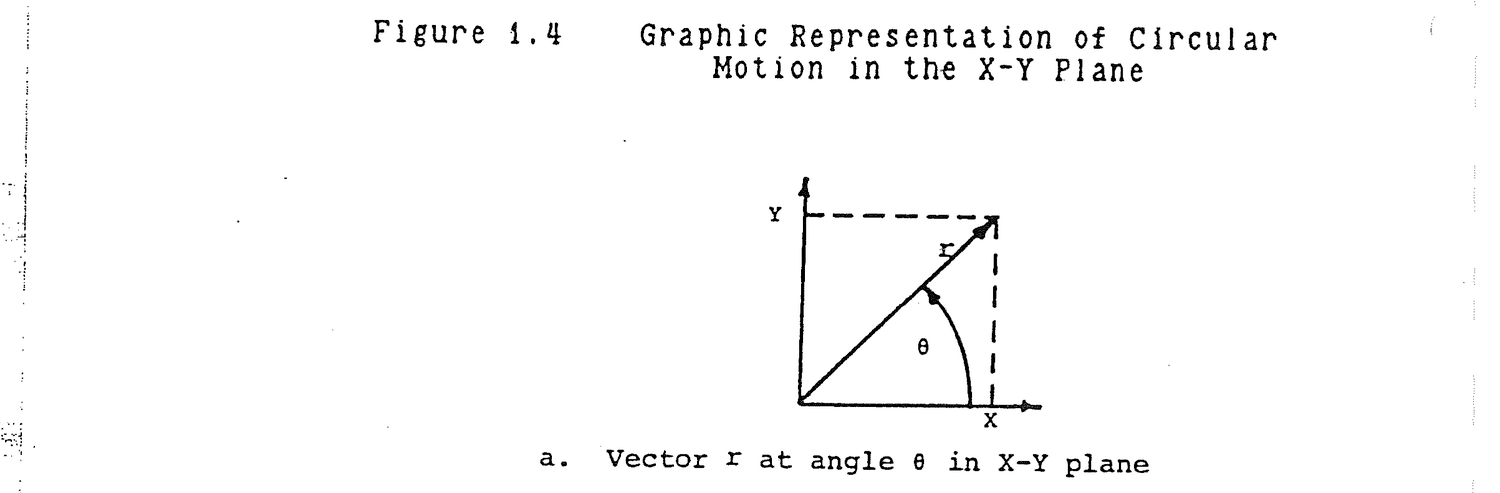
From Figure 1.4.a,
Sineθ = Y/r                                                    (1.44)
Cosineθ = X/r                                                  (1.45)
Tangentθ = Y/X                                                 (1.46)
The values of these functions vary with angle over a circular, 360° repetition. The values of each function are equal at θ, 360+θ, 720+θ, and so on. Figure 1.4.b provides an illustration of the circular rotation of a vector r through an angle θ in the X-Y plane.
When θ is zero, r is along the X axis. X = r, Y = 0, cosine θ = 1, and sine θ = o. When θ = 45°, X, Y, and r form a right triangle. The projection of r on the X axis equals the projection on the Y axis. From equations (1.44) and (1.45),
Y = rsineθ
X = rcosθ
At this angle,
Y = X
sinθ = cosθ
Applying the Pythagorean theorem,
X2 + Y2 = r2
But, since X = Y,
2X2 = r2

X = r/√ 2
substitute this value in equation (1.45).
cos 45° = 1/√ 2

= .707

= sin 45°
It is customary to represent angles in radians. Remember that π was the ratio of a circle's circumference to its diameter. The ratio of circumference to radius is 2π.
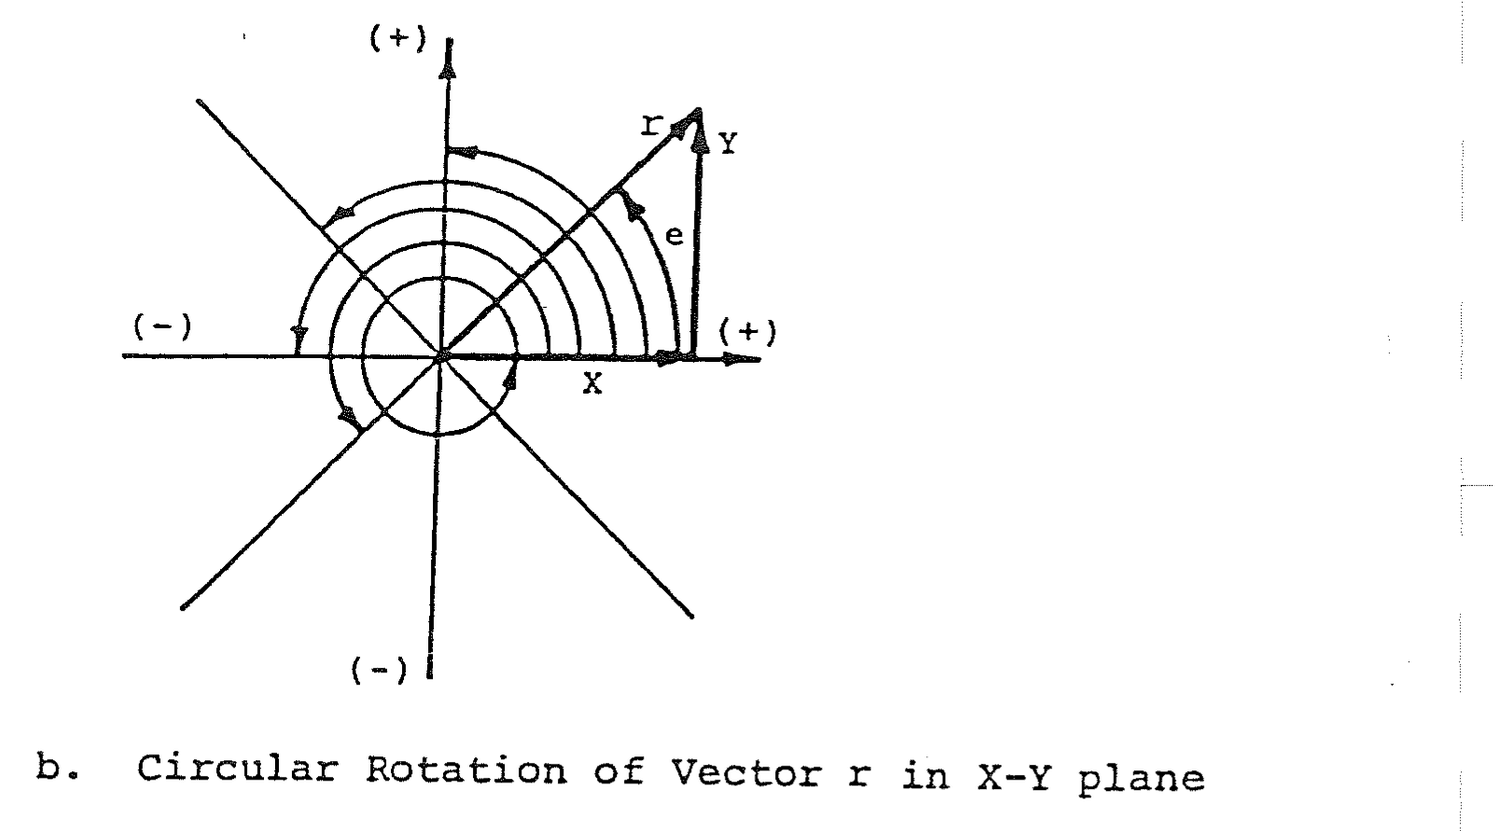
If a number of radii were stretched around a circle, 2π of them would enclose it. The angle subtended by a single radius along a circle's circumference is one radian or 57.3°. If there are 2π radians in 360°, π radians are 180°, π/2 radians are 90°, and 3π/2 radians are 270°.
As θ increases to 90° or π/2, Y = r, X = 0, sinθ = 1, and cosineθ = 0. The trend continues, but the arithmetic sign of the trigonometric functions changes when X and Y become negative as θ proceeds around the circle to 360°. The following table summarizes the values of sine, cosine, and tangent at every angular change of 45°.
Table 1.1  Trigonometric Functions

         Angleθ           X        Y      sinθ      cosθ      tanθ
(degrees) (Radians)
   0         0            r        0        0         1         0
  45        π/4         .707r    .707r    .707      .707        1
  90        π/2           0        r        1         0         ∞
 135       3π/4        -.707r    .707r    .707     -.707       -1
 180        π            -r        0        0        -1         0
 225       5π/4        -.707r   -.707r   -.707     -.707        1
 270       3π/2           0       -r       -1         0        -∞
 315       7π/4         .707r   -.707r   -.707      .707       -1
 360       2π             r        0        0         1         0
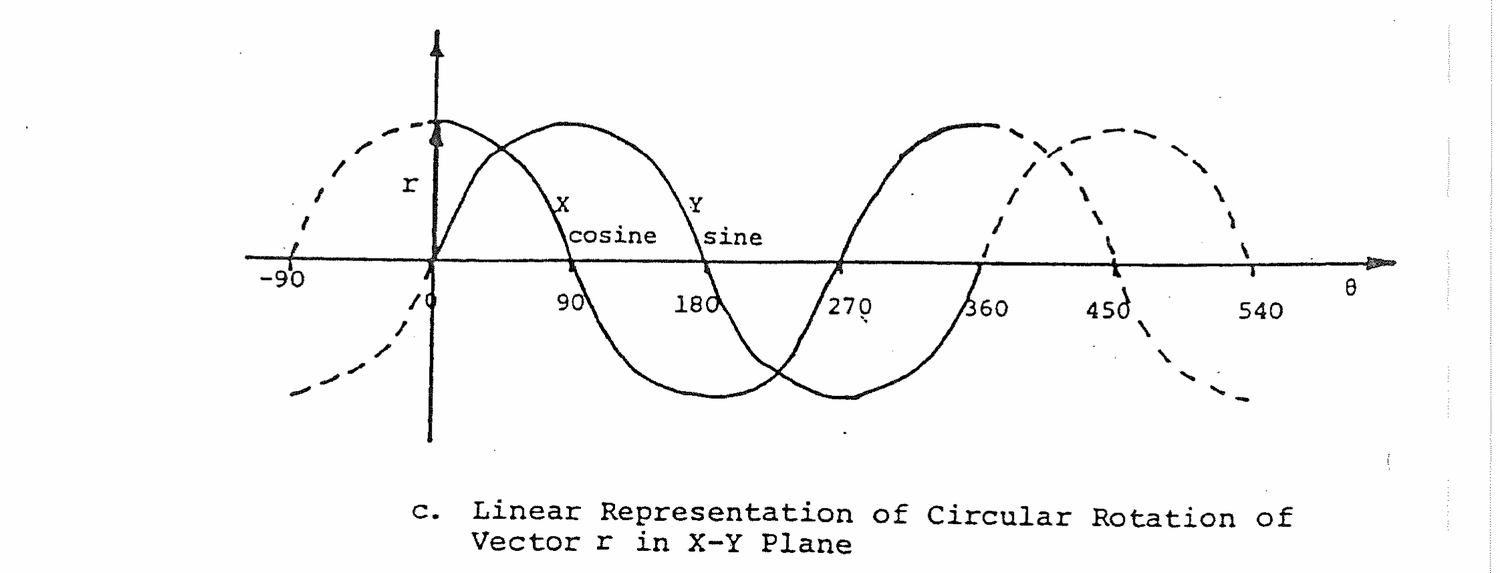
Figure 1.4.c is a linear plot of X and Y as functions of angle θ. The linear plots take on the traditional cosine and sine wave shapes when plotted in this manner. The wave shape varies over a 360° cycle and then repeats itself every 360°.
The infinite series,
1 + K + K2 + K 3 + . . . . . . . . + Kn (1.47)
is used to represent the process of subcritical multiplication. If K is less than one, each succeeding term becomes smaller and the series converges to
1/(1-K) (1.48)
The truth of equation (1.48) can be shown by algebraically dividing (1-K) into 1.
Table 1.2  Derivatives and Integrals

Function       First Derivative      Second Derivative      Integral

  f(x)              df/dx              d2f/dx2              ∫fdx

  C                   0                    0                  CX
  X1/2             1/2 X-1/2          -1/4 X-3/2          2/3X3/2
  X                   1                    0                  1/2X2
  CX                  C                    0                  1/2CX2
  X2                 2X                   2                  1/3X3
  X3                 3X2                  6X                 1/4X4
  X4                 4X3                 12X2                1/5X5
  7X4               28X3                 84X2                7/5X5
  X-1/2           -1/2X-3/2           3/4X-5/2            2X1/2
  1/X                -X-2                 2X-3                lnX
  e-λX              -λe-λX               λ2e-λX              -1/λe-λX
  Xe-λX            e-λX-λXe-λX       -2λe-λX+λ2Xe-λX
  sinX               cosX                -sinX               -cosX
  cosX              -sinX                -cosX                sinX
  sinX2            2XcosX2       2cosX2-4X2sinX2
cos(πX/2)     -π/2 sin(πX/2)     -π2/4 cos(πX/2)     2/π sin(πX/2)
The bases for differentiation and integration are derivable, but it is simpler to learn the processes just as one learns multiplication, division, addition, and subtraction, by memorization and practice. Tables of derivatives and integrals are also readily available. Table 1.2 provides the derivatives and integrals most commonly encountered in reactor operations. The independent variable used is X, but it could have been t or any other variable chosen.
A differential equation is a mathematical statement of a problem in terms of derivatives which can be solved by integration.
Five major applications of differential equations occur in reactor operations: reactor power determination, radioactive decay, shielding attenuation, neutron activation, and core neutron flux determination.
In determining reactor power, the time rate of change of power, dP/dt, is the statement of power variation. In terms of reactor period, T, the rate of change of power is,
dP/dt = (1/T)P (1.49)
The variables are separated by algebra.
dP/P = (1/T)dt
Both sides are integrated. The limits of integration on the left are from initial power, P0, to final power, P. On the right, time is integrated from zero to t.
∫ dP/P = ∫ (1/T) dt
Both of these integrals are in Table 1.2.
       P                  t
ln P ]      = (1/T)t ]
       P0            0
The limits of integration are evaluated as follows.
ln P - ln P0 = (1/T)t - (1/T)0

              = t/T
Raise both sides to an exponential and the equality is preserved.
elnP-lnPo = et/T

          = elnPe-lnPo

          = elnP/elnPo

          = P/P0
Thus,
P/P0 = et/T
or,
P = P0et/T (1.50)
Equation (1.50) is the solution to differential equation (1.49). This equation and the solution are shown in Figure 1.5 along with a plot of power, P, versus time, t, which is simply a plot of equation (1.50).
The equations and solutions for radioactive decay and shielding attenuation are literally identical in form to equation (1.49) except for a change in variables. The plots of decay and attenuation are negative exponentials indicating a decrease with time and shield thickness, respectively, rather than an increase as was the case with power.

                      Differential Equation                Solution

Reactor               dP/dt = (1/T)P                       P = Poet/T
Power
Determination

Radioactive           dA/dt = -λA                          A = Aoe-λt
Decay

Shielding             dI/dx = -μI                          I = Ioe-μx
Attenuation

Neutron               dNa/dt = Ntσtφ -λNa                 Na = Ntσtφ/λ
Activation                                                      X(1-e-λt)

                                    Σa-νΣf                              Σa-νΣf
Core                  d2φ/dX2 = (----------)φ            φ = φo cos √ ---------- X
Neutron                                   D                                     D
Flux                                                         = φo cos (πX/a)
Neutron activation has a somewhat more complex statement and solution because activated isotopes reach a balance between formation by neutron activation of target atoms, Ntσtφ, and decay, -λaNa. In activation, an isotope builds up from nothing to an equilbrium level where formation and decay are in balance.
Steady state core flux involves a second derivative with respect to position, X, in the core. The solution to the second derivative, which is called a second order differential equation, provides the expected cosine shape of flux across the core.
1.7.1 A gas in a tank at 300 K has a pressure of 100 psi. The pressure of a gas is directly proportional to its absolute temperature. If the temperature increases to 500 K, what will the pressure be?
Solution
P2/P1 = T2/T1

P2 = P1(T2/T1)

= 100 psi (500 K/300 K)

= 167 psi
1.7.2 A turbine rotates at 1800 rpm (revolutions per minute). The largest low pressure turbine blades have a 12-foot diameter. What is the linear speed of the tip of the largest low pressure turbine blades in feet per second?
Solution
In one revolution, the tip of the 12 foot diameter blade travels a distance,
1 rev = π diameter = 2πr

= π(12 ft)

= 38 ft

v = (1800 rev/min)(38 ft/rev)(1 min/60 sec)

= 1140 ft/sec
1.7.3 The volume of a cylindrical reactor core is 1357 ft3 and the diameter is approximately equal to the height. Find the height of the reactor core.
Solution
V = πr2h

Diameter = 2r = h

r = h/2

V = π(h/2)2h

  = πh3/4

h = 3√ 4V/π

  = (4(1357 ft3)/π)1/3

  = 11.71 ft
1.7.4 Write the exponential and logarithmic relationships of the number 8 and exponent 3 with base 2.
Solution:
8 = 23

3 = log28
1.7.5 Joe has a height (h1) of 64 inches; Jim has a height (h2) of 72 inches; Jack has a height (h3) of 66 inches; John has a height (h4) of 70 inches; Jeff has a height (h5) of 60 inches; and Harry has a height (h6) of 76 inches. Does anyone in this group have the average height?
Solution:
         6
hav  = Σ hi/6
        i=1

    = (64+72+66+70+60+76) in/6

    = 68 in
No one in the group is of average height.
1.7.6 A series of 10 second duration counts are taken on two detectors.
            Detector 1                    Detector 2

100       93      105          1000     982    1060
140       87      110          1050     960     950
104       78       90           940    1035     975
102       94       95          1075    1020     942
 97      103      112          1020     990    1015
(a) Calculate the average counts in 10 seconds, cts;
(b) Calculate the standard deviation of each set, cts;
(c) How many of the counts are greater than one standard deviation from the average;
(d) Are the detectors functioning properly?
Solution:
                        Detector 1          Detector 2
             15
(a) Cav = ΣCi/15    1520/15 = 101     15,014/15=1001
            i=1

(b) σ = √ Cav            10                  32

(c) ABS(Ci-Cav)>σ         5                   8

(d)                        yes            No, more than
                                          1/3 of the
                                          counts vary
                                          from the
                                          average by
                                          greater than a
                                          standard
                                          deviation.
1.7.7 Use the formula P = P0(10)SURt with P0 = 200 watts and SUR = 0.25 DPM to calculate reactor power (P) at the following times (t):
(a) 30 seconds
(b) 2 minutes
(c) 0.2 hours
1.7.8 Plot the equation A = A0e-λt given that A0 = 100 curies (radioactivity unit) and λ = 0.132 yr-1 over a period of 25 years.
1.7.9 A tank is filled to the 500-gallon mark in ten minutes. After an additional ten minutes, a leak develops, and the tank empties at a constant rate over a period of twenty minutes. Plot the curves for the volume and flow rate versus time.
1.7.10 Use interpolation to find the temperature of saturated steam at a pressure of 275 psia, given the following portion of a steam table:
P (psia)                        T(F)

200                             382

300                             417
1.7.11 In a nuclear reactor, some neutrons are born directly after fission (prompt neutrons) and some are born seconds later (delayed neutrons). Find the average lifetime of prompt and delayed neutrons, given that out of a 10,000 neutron sample, 9940 are prompt with a lifetime (l*) of 5 x 10⁻⁵ seconds and 60 are delayed with a lifetime (t) of 10 seconds.
1.7.12 In determining reactor response, the fraction of neutrons born some time after fission (i.e., the delayed neutron fraction, β) must be known.
Calculate βav given the β's and fractions, F, of the individual fuels in a reactor.
Fuel               Fi            βi

U-235              0.58          0.0065

U-238              0.07          0.0148

Pu-239             0.35          0.0021
1.7.13 Write the following numbers as exponentials:
(a) 14.6
(b) 173.4
(c) .00063
(d) 711.00
(e) 1,750,000
(f) 456,000
(g) .0000064
1.7.14 Perform the indicated calculations using scientific notation without rounding the answers.
(a) (5.2x10⁴) + (3.1x10²) + (2x10³)

(b) (8.2x10⁻¹) + (3.5x10⁻²) + (2.1x10⁻³)

(c) Subtract (2x10³) from (5.2x10⁴)

(d) Subtract (2.1x10⁻³) from (3.5x10⁻²)

(e) (3.2x10⁵) (5.4x10⁵)

(f) (4x10⁻⁹)(2.8x10⁴)

(g) (1.6x10⁻⁵)(8.2x10⁻³)

(h) (-2.2x10⁴)(4.1x10²)

(i) 6.6x10⁴/2.2x102

(j) 8.4x10⁻⁴/4.2x10-3

(k) 1,600,000x4,000/8,000x1,600

(l) 0.00064x180/60x0.00080

(m) 1,000x4.20/50x2,000,000
1.7.15 A power plant puts out 1.15 x 10⁶ watts. How many megawatt days will the plant put out during the month of June if it operates for the entire month at this power level?
1.7.16 How many days will a 75 watt light bulb burn for one dollar's worth of electricity if the cost of electricity is $.06/kw-hr.
1.7.17 (a) A private plane uses 10.2 gal/hr of fuel while traveling at 177 mph. How far can it travel on 64 gallons of fuel?
(b) If aviation fuel costs $.65/gal, what is the cost of fuel per mile?
(c) What is the plane's mileage in mpg?
1.7.18 A reactor heats up at a rate of 50 F/hr. Each degree of temperature is equivalent to 1.5x10⁻⁴ ΔK/K. Each inch of control rod motion corresponds to 3.0x10¹⁰-4 ΔK/K. Use dimensional analysis to determine the control rod motion (in inches/min) that accompanies the heatup.
1.7.19 A reactor operates at full power for one year, producing an average of 1,100 megawatts. You are given the following equalities:
1 watt = 1 joule/sec

1 ev = 1.6 x 10⁻¹⁹ joules

1 fission = 200 Mev

1 amu = 931 Mev

1 amu = 1.67 x 10⁻²⁴ gm

1 fission =  275 amu (of fuel used)
(a) What is the mass (in grams) converted to energy?
(b) What is the mass of fuel used (in kg)?
1.7.20 Write the following expressions in the form of a base raised to an exponent (2X) and then determine its numerical value up to three decimal places:
(a) 2 x 2 x 2         = 2               =____________________

(b) 1/23               = 2               =____________________

(c) 3√ 25             = 2               =____________________

(d) 27/24             = 2               =____________________

(e) 25/28             = 2               =____________________

(f) 27 x 2-5          = 2               =____________________

(g) (23)3             = 2               =____________________

(h) (22)3 x 2-6      = 2               =____________________

(i) 1/2-5              = 2               =____________________

(j) 1/3√ 25           = 2               =____________________
1.7.21 Express the numerical value of the following expressions.
(a) ln 20                =               ____________________

(b) ln e5                =               ____________________

(c) eln5                =               ____________________

(d) ln 10                =               ____________________

(e) ln 102               =               ____________________

(f) ln 103               =               ____________________

(g) e5                   =               ____________________

(h) e-5                  =               ____________________

(i) ln 5                 =               ____________________

(j) ln 54                =               ____________________
1.7.22 The world population now (P0) is 8 billion and its doubling time (DT) is 37 years. How many years (t) will it take for the world's population (P) to reach 100 billion?
1.7.23 The following graph represents the amount of uranium-235 in a core over the course of a year.
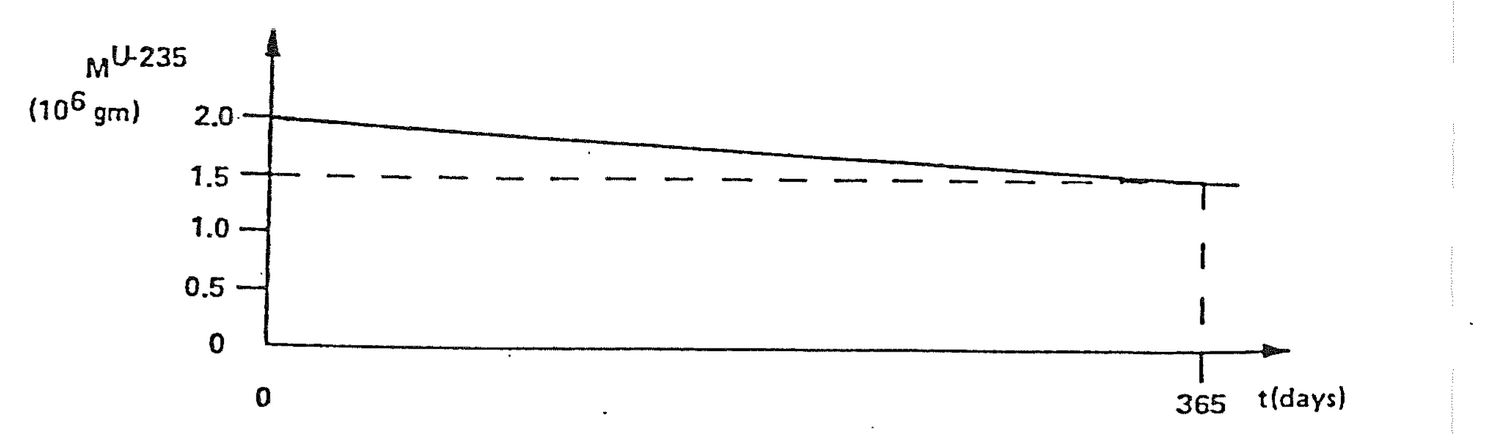
(a) What are the units of the slope of the line?
(b) What physical quantity is represented by the slope of the line?
(c) What is the value of the slope of the line?
(d) What is the sign of the slope and what is the physical significance of the sign?
1.7.24 The fission of uranium-235 produces six groups of delayed neutrons, each with a different half-life (time for half the delayed neutrons to appear). Find the average half-life (T2).
Fractions (104)              Half-life (sec)

β1 =  2.15                     55.72

β2 = 14.25                     22.72

β3 = 12.74                      6.22

β4 = 25.68                      2.30

β5 =  7.48                      0.610

β6 =  2.73                      0.230
1.7.25 Prove that:
sin2θ + cos2θ = 1
1.7.26 Given:
dA/dt = -λA
Prove:
A = A0e-λt
1.7.27 Given:
dI/dX = -μI
Prove:
I = I0e-μX
This particle has a rest mass, me = 9.10956x10⁻²⁸g, and carries a charge e = 1.60219x10⁻¹⁹ coulombs. There are two types of electrons, one carrying a negative charge -e, the other carrying a positive charge +e. Except for the difference in the sign of their charge, these two particles are identical. The negative electrons, or negatrons, as they are sometimes called, are the normal electrons encountered in this world. Positive electrons, or positrons, are relatively rare here. When, under the proper circumstances, a positron collides with a negatron, the two electrons disappear and two (and occasionally more) photons, particles of electromagnetic radiation, are emitted. This process is known as electron annihilation and the photons that appear are called annihilation radiation.
Calculate the energy (KeV) of each of the two photons emitted in positron annihilation.
Ephoton = Etotal/2

         = (me- + me+) c2/2

         = (2 me-) c2/2

         = me- c2

         = (9.11x10⁻²⁸g)(3.00x1010 cm/sec)2

         = 8.20x10⁻⁷ gm cm2/sec2

         = 8.2x10⁻⁷ erg

         = (8.2x10⁻⁷ erg)(eV/1.60x10-12 erg)
           (KeV/1000eV)

         = 511 KeV
This particle has a rest mass mp = 1.67261x10⁻²⁴g and carries a positive charge equal in magnitude to the charge on the electron. Protons with negative charge have also been discovered, but these particles are of no importance in nuclear engineering.
Calculate the ratio of proton and electron masses.
mp/me = 1.67x10⁻²⁴g/9.11x10-28g

      = 1,833
The mass of the neutron is slightly larger than the mass of the proton, namely, mn = 1.67492x10⁻²⁴g, and it is electrically neutral. The neutron is not a stable particle, however, except when it is bound into an atomic nucleus. A free neutron decays to a proton with the emission of a negative electron (β-decay) and an antineutrino, a process that takes on the average of about 12 minutes.
Write the equation for neutron decay.
      12m
0n1  -->  1p1 + -1β0
Calculate the neutron decay mass defect.
mn       = 1.67492x10⁻²⁴g

mp + me = 1.67261x10⁻²⁴g + 9.10956x10⁻²⁸g

        = 1.67352x10⁻²⁴g

mn - (mp+me) = 1.39904x10⁻²⁷g
Determine the neutron decay mass defect in MeV.
mn - (mp+me) = (1.39904x10⁻²⁷g)(3.00x1010 cm/sec)2

             = 1.25914x10⁻⁶ gm cm2/sec2

             = 1.25914x10⁻⁶ erg

             = (1.25914x10⁻⁶ erg)(eV/1.60x10-12 erg)

                  (MeV/106eV)

             = 0.787 MeV
It is a curious fact that all particles in nature behave sometimes like particles and sometimes like waves. Thus, certain phenomena that are normally thought of as being strictly wave like in character also appear to have an associated corpuscular or particle like behavior. Electromagnetic waves fall into this category. The particle associated with electromagnetic waves is called the photon. This a a particle with zero rest mass and zero charge, which travels in a vacuum at only one speed, namely, the speed of light, c = 2.9979x1010 cm/sec.
Cobalt-60 emits two gamma rays per decay, 1.332 MeV and 1.174 MeV, with a total energy of 2.506 MeV. Determine the total energy (kw-hr) deposited in a reactor core by the radioactive decay of a single cobalt-60 atom.
Eco = (2.506 MeV)(106eV/MeV)(1.60x10-19 w-sec/eV)
      (kw/1000w)(hr/3600 sec)

    = 1.114x10⁻¹⁹ kw-hr
How much energy (Mw-day) is produced by a 3,000 Mw(t) reactor operating for one year?
Ereactor = (3,000 Mw)(365 day)

         = 1,095,000 Mw-day

         = 1.095x10⁶ Mw-day
Determine the total number of cobalt-60 decays that would be necessary to produce the energy of a 3,000 Mw(t) reactor operating for one year.
N = Ereactor/Eco

  = (1.095x10⁶ Mw-day)(1,000 kw/Mw)(24 hr/day)/
    (1.114x10⁻¹⁹kw-hr)

  = 2.359x1029 atoms
This is another particle with zero rest mass and no electrical charge which appears in the decay of certain nuclei. There are actually two types of neutrinos, called, respectively, nutrinos and antineutrinos, but for most purposes it is not necessary to make a distinction between the two.
An alpha particle is a helium nucleus containing two neutrons and two protons, but without the outer electrons of the helium atom. The mass of an alpha particle is Mα = 6.70x10⁻²⁴g and the particle carries two positive charges each equal to the charge of an electron. Alpha particles are emitted in radioactive decay and fission.
Determine the total mass of the constituents of an alpha particle.
mα = 2 mp + 2 mn

   = 2(mp + mn)

   = 2(1.67261x10⁻²⁴ + 1.67492x10⁻²⁴)g

   = 6.69506x10⁻²⁴g
Atoms are the building blocks of gross matter as it is seen and felt. The atom consists of a small, massive nucleus surrounded by a cloud of rapidly moving, negative electrons. The nucleus is composed of protons and neutrons. The total number of protons is called the atomic number and is designated Z. The total number of protons and neutrons is the atomic weight, A. An element is determined by the number of protons.
State the number of protons and neutrons in and the gram atomic weight (M) of:
                Protons      Neutrons       M/(g)

1H1              1            0            1

7N14             7            7           14

 N(natural)     7           7 or 8       14.008
                                        (Table 2.3)

8O16             8            8           16

11Na23          11           12           23

12Mg27          12           15           27

16S32           16           16           32

17Cl36          17           19           36

20Ca40          20           20           40

24Cr51          24           27           51

25Mn56          25           31           56

26Fe59          26           33           59

 Fe(natural)   26     28, 30, 31, or32   55.85
                                       (Table 2.3)
A molecule is a group of atoms bound together by common sharing of electrons associated with the atoms. The total mass of a molecule, called the molecular weight, is the sum of the atomic weights of the constituent atoms.
Compounds and chemical bonds are formed by sharing electrons. Atoms or atom groups with excess electrons (+ valence) share those with atoms or atom groups having an electron deficiency (- valence).
Atom or Atom Group              Valence

        H                         +1
        O                         -2
        Cl                        -1
        Ca                        +2
        NO3                       -1
        SO4                       -2
Write the chemical equations for:
Water                           H2O

Hydrochloric acid               HCl

Nitric acid                     HNO3

Sulfuric acid                   H2SO4

Calcium chloride                CaCl2

Calcium oxide                   CaO

Calcium nitrate                 Ca(NO3)2

Calcium sulfate                 CaSO4
Atomic and molecular weights are unitless numbers, being ratios of the masses of atoms and molecules. By contrast, the gram atomic weight and gram molecular weight are the amount of a substance having a mass in grams equal to the atomic or molecular weight of the substance. This amount of material is also called a mole and is designated M.
Substance             Gram Atomic/Molecular Weight

Uranium                        238.070

Boron                           10.820

Carbon                          12.011

 Boron Carbide (B4C)            55.291
A gram atomic or gram molecular weight of any substance has Avogadro's number, Na, of atoms or molecules which is 6.023x10²³.
Determine the gram molecular weight (m) of Ca(NO3)2.
M = Ca +2N +6O

  = 40.08 + 2(14.0067) + 6(15.9994)

  = 164.0898g
Determine the number of molecules in 164g, 328g, and 1 kg of Ca(NO3)2.
N(164g) = Na W/M

        = 6.023x10²³ (164)/164

        = 6.023x10²³ molecules

N(328g) = 6.02x10²³ (328)/164

        = 1.20x1024 molecules

N(1 kg) = 6.02x10²³ (1000)/164

        = 3.67x1024 molecules
Determine the number of atoms in 1 kg of Ca(NO3)2.
Atoms/molecule = 1 Ca + 2N +6O

               = 9

Atoms (1 kg)   = (3.67x1024 molecules/kg)

                    (9 atom/molecule)

               = 3.30x1025 atoms
The size of an atom is somewhat difficult to define owing to the fact that the atomic electron cloud does not have a well defined outer edge. Electrons may, from time to time, move
very far from the nucleus, while at other times they pass close to the nucleus. A reasonable measure of atomic size is given by the average distance from the nucleus that the outermost electron is to be found. Except for a few of the lightest atoms, these average radii are approximately the same for all atoms, namely about 2x10⁻⁸cm. The wavelength of light is measured in angstroms, 10-8cm, which is approximately the atomic radius.
The nucleus, like the atom, also does not have a sharp outer boundary. Its surface, too, is diffuse, although somewhat less than that of an atom. Measurements in which neutrons are scattered from nuclei show that to a first approximation the nucleus may be considered to be a sphere with a radius given by the following formula:
R = 1.25x10⁻¹³A1/3, (2.1)
where R is in centimeters and A is the atomic mass number. For a representative atom, the nuclear radius is approximately 1x10-12 cm. The geometric cross sectional area of such an atom is on the order 1x10-24cm2 which is defined as 1 barn. As will be seen, based on geometry alone, every atom would have a cross section of about 1 barn.
Determine the approximate nuclear radius, R, (cm) of:
                  Atomic Mass        Nuclear
                    Number         Radius (cm)

Hydrogen               1        R = 1.25X10⁻¹³(1)1/3

                                  = 1.25x10⁻¹³

Boron                10.82      R = 1.25x10⁻¹³(10.82)1/3

                                  = 2.74x10⁻¹³

Uranium             238.07      R = 1.25x10⁻¹³(238.07)1/3

                                  = 7.61x10⁻¹³
Calculate the approximate number of uranium nuclei volumes that could theoretically fit within the volume of a uranium atom.
Vatom = 4πR3atom/3
      = 4π(2x10⁻⁸)3/3

      = 3.35x10⁻²³ cm3

Vnucleus = 4πR3nucleus/3

         = 1.85x10-36 cm3

Vatom/Vnucleus = 3.35x10⁻²³/1.85x10-36

              = 1.81x10¹³
One of the striking results of Einstein's theory of relativity is that mass and energy are equivalent and convertible, one into the other. In particular, the complete annihilation of a particle or other body of rest mass, mo, releases an amount of energy, E, which is given by Einstein's formula
E = moc2, (2.2)
where c is the speed of light.
In nuclear fission, the difference between the masses of excited U-236 and the sum of all the fission products represents mass that has been converted to energy in the form of heat.
Another unit of energy that is often used in nuclear engineering is the electron volt, denoted by a eV. This is defined as the increase in the kinetic energy of an electron when it falls through an electrical potential of one volt. This, in turn, is equal to the charge of the electron multiplied by the potential drop, i.e.,
1eV = 1.60219x10⁻¹⁹ coulomb X 1 volt

    = 1.60219x10⁻¹⁹ joule

    = 1.60219x10⁻¹⁹ watt-sec

    = 1.60219x10⁻¹² ergs
Other energy units frequently encountered are the MeV(106eV) and the keV(103eV).
In fission, approximately 200 MeV of energy are released per fission. That corresponds to 3.2044x10⁻¹¹ joules, 3.2044x10⁻¹¹ watt-sec, and 3.2044x10⁻⁴ ergs.
Define an electron-volt.
An electron-volt is the amount of energy consumed by pulling the charge on one electron across a potential drop of one volt.
Calculate the energy equivalent of an electron-volt in coulomb-volts, watt-seconds, and kilowatt-hours.
Electron charge      = 1.60219x10⁻¹⁹ coulomb

(1 electron)(1 volt) = (1.60219x10⁻¹⁹ coulomb)
                       (1 volt)

                     = 1.60219x10⁻¹⁹ coulomb-volt

1 coulomb-volt       = 1 joule

1 watt = 1 joule/sec

Therefore:

1 watt-sec = 1 joule = 1 coulomb-volt

and

1eV = 1.60219x10⁻¹⁹ watt-sec

    = (1.60219x10⁻¹⁹ watt-sec)(kw/1000w)
      (hr/36000 sec)

    = 4.45053x10⁻²⁶ kw-hr
Calculate the kw-hr of energy released per U235 fission.
(200 MeV/fiss)(1x106eV/MeV)(4.45053x10-26kw-hr/eV)

        = 8.9106x10⁻¹⁸kw-hr/fiss
Determine the energy released, Mw-day, from the complete annihilation of 1 gram of matter.
E = mc2

  = (1g)(2.9979x1010cm/sec)2

  = 8.9874x10²⁰ g cm2/sec2

  = 8.9874x10²⁰ erg

  = 8.9874x10²⁰ erg (1.60219x10⁻¹⁹w sec)/
    (1.60219x10⁻¹² erg)

  = 8.9874x10¹³ w-sec

  = (8.9874x10¹³ w-sec)(Mw/106w)(hr/3600 sec)
    (day/24 hr)

  = 1040 Mw-day
Determine the mass defect of a thermal neutron - boron 10 interaction.
0n1 + 5B10 --> 3Li7 + 2α4

                  Chart of Nuclides
                  Atomic Mass Units (amu)

0n1              1.008665

5B10            10.012938

TOTAL            11.021603


3Li7             7.016005

2α4              4.002604

TOTAL            11.018609

Mass Defect = 11.021603 - 11.018609
            = 0.002994 amu

            = (0.002994 amu)(1.66053x10⁻²⁴g/amu)

            = 4.97163x10⁻²⁷ g
What happens to the mass that is lost in the above example?
The mass defect is converted to kinetic energy of the 3Li7 and 2α4 and a 0.480 MeV gamma is given off
E = Mc2

  = (4.97163x10⁻²⁷g)(2.9979x1010cm/sec)2

  = 4.4682x10⁻⁶ erg

  = (4.4682x10⁻⁶erg)(MeV/1.60219x10-6erg)

  = 2.790 MeV

ELi+Eα = 2.790 - 0.480 (gamma)

        = 2.31 MeV
How is the energy divided up between the 3Li7 and the 2α4 in the above example?
Momentum must be conserved.

0n1 --> 5B10               3Li7 -->
                <-- 2α4

mLivLi = mαvα

Since:

E = mv2/2

then,

v = (2 E/m)1/2

mLi(2ELi/mLi)1/2 = mα (2E /mα)1/2
(2ELimLi)1/2 = (2Eαmα)1/2

ELimLi = Eαmα

ELi = Eαmα/mLi

    = Eα(4.002604/7.016005)

    = 0.57 Eα

From the preceding example,

ELi = 2.31 - Eα

0.57Eα = 2.31 - Eα

1.57 Eα = 2.31

Eα = 1.47 MeV

ELi = 2.31 - 1.47

    = 0.84 MeV
The physcial density or specific gravity, p, of a substance is the gm/cm3. If M is the gram atomic/molecular weight, gm/mole, it follows that ρ/M is the moles/cm3. A mole contains Avogadro's number of atoms/molecules. Thus number density is
N = ρNa/M atoms/cm3 (2.3)
Weight fraction of a substance is the gm of substance/gm total mixture. Atom fraction is the number of atoms of substance/total atoms of mixture. Volume fraction is the cm3 of substance/cm3 of mixture. These concepts are represented pictorially in Figure 2.1.
Volume fraction (VF) is calculated using
VFA = (WFA/ρA)/(WFA/ρA + WFB/ρB) (2.4)
Each quotient WF/ρ in equation (2.4) represents the cm3 of substance/gm of mixture.
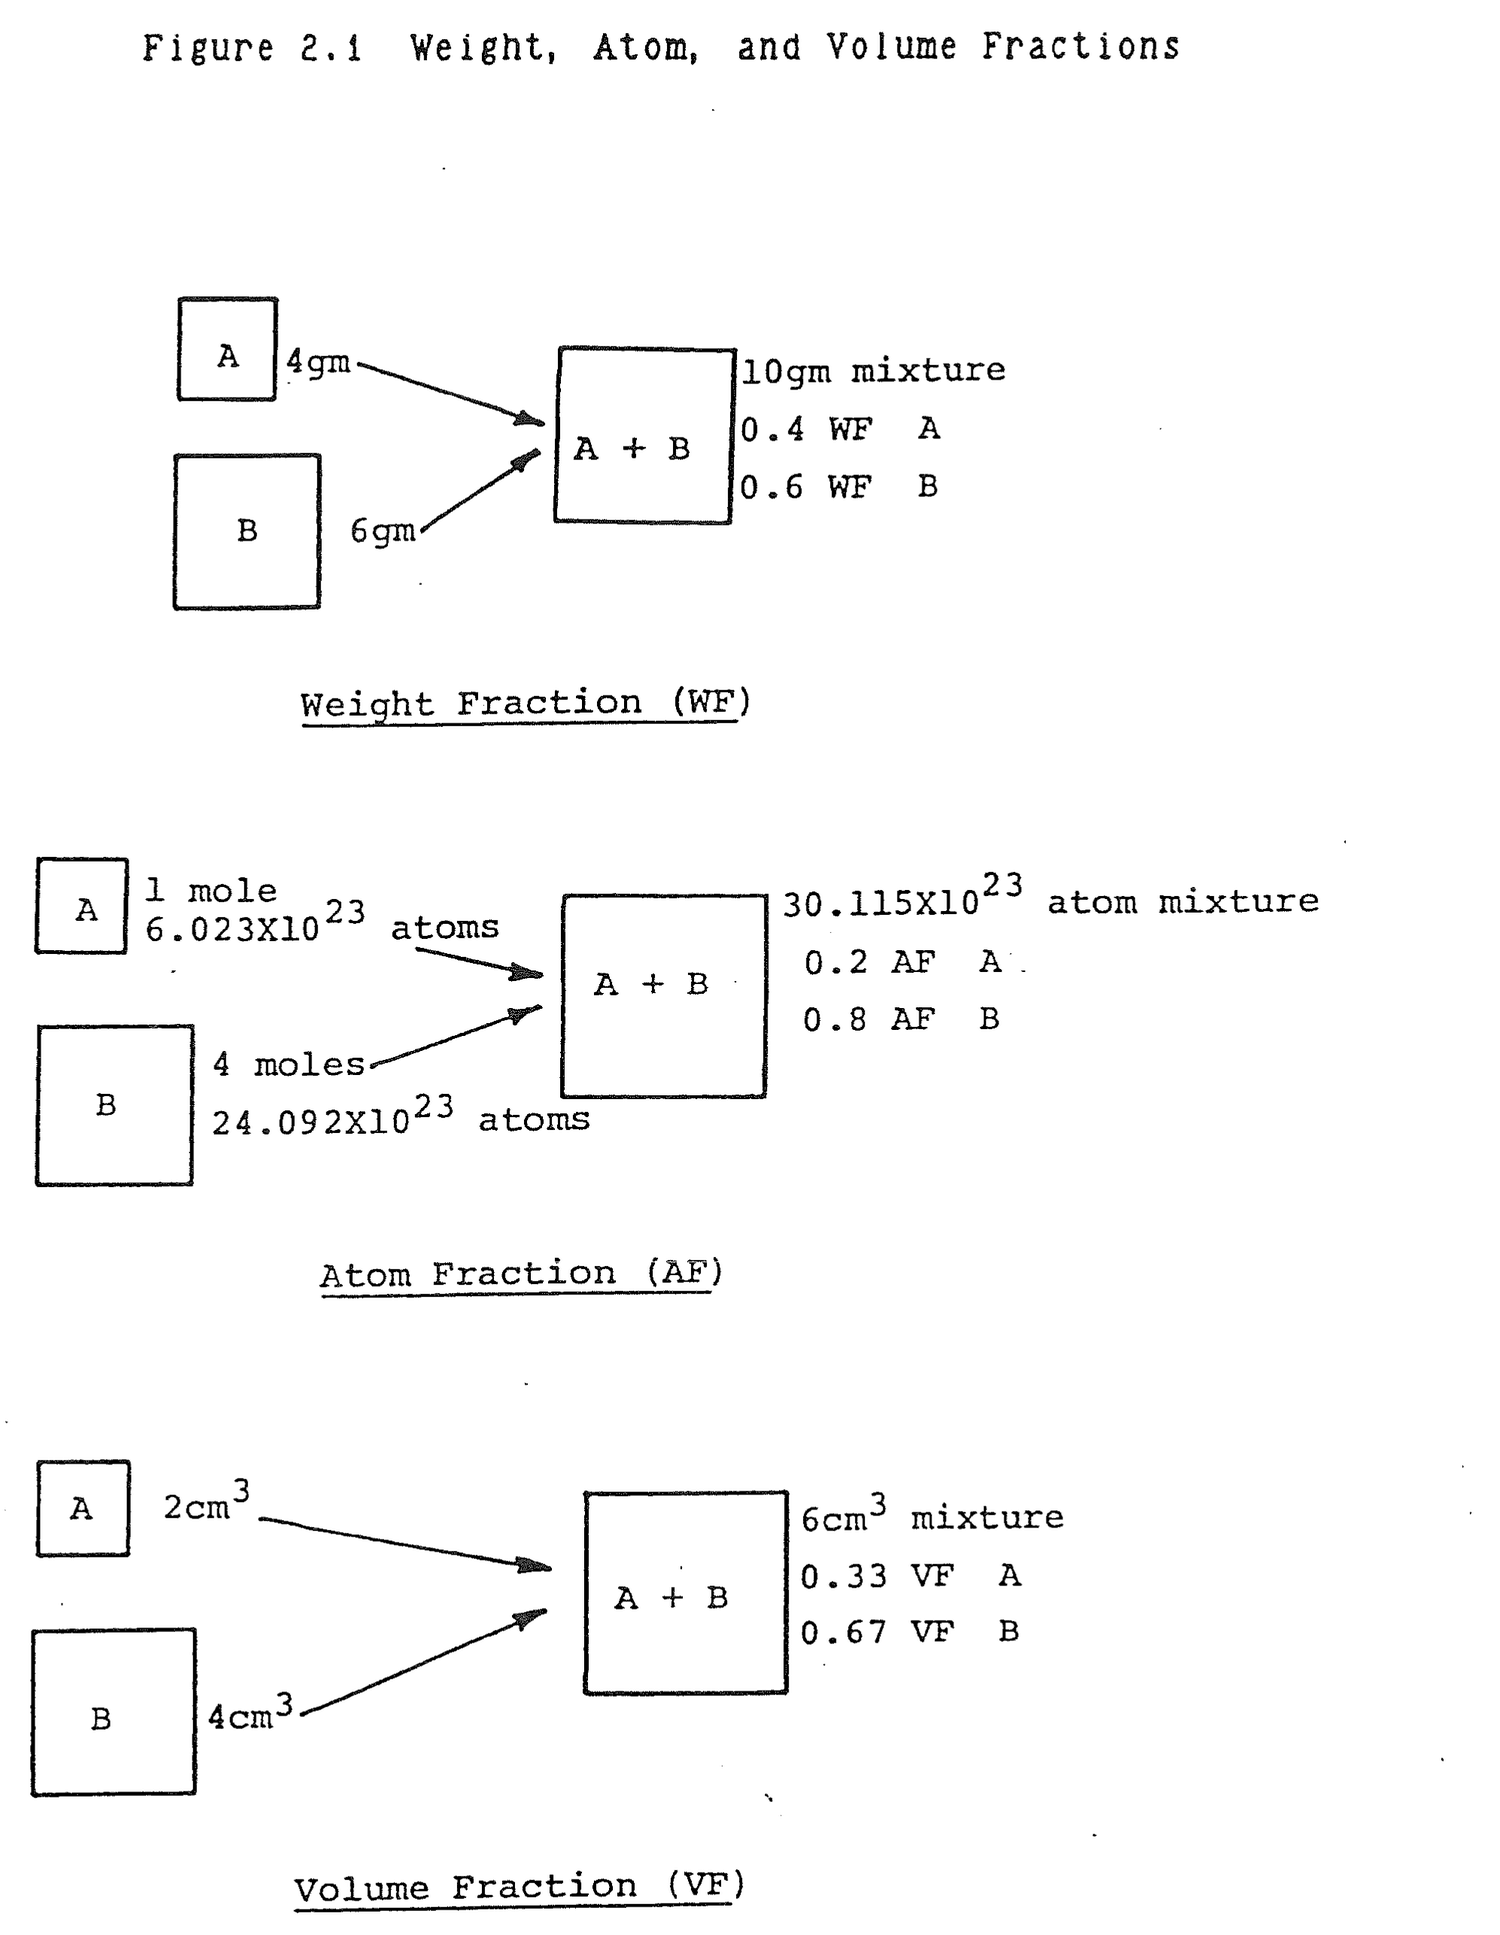
Weight fraction is misleading when there are large gram atomic weight differences between substances in a mixture. Atom fraction provides the best picture of the composition of a mixture.
Find the density of natural uranium, g/cc, in Table 2.3. Using that value, calculate the natural uranium number density, atom/cc.
ρu = 18.9 g/cc

Nu = ρuNa/M

   = (18.9 g/cc)(6.023x1023 atom/mole)/
     (238.07g/mole)

   = 4.78x10²² atom/cc
Calculate the number of uranium atoms in a solid sphere of natural uranium 4 inches in diameter.
V = 4πR3/3

  = 4π(2in)3/3

  = 33.51 in3

  = (33.51 in3)(2.543 cc/in3)

  = 549.14 cm3

Atoms = V Nu

      = (549.14 cc)(4.78x10²² atom/cc)

      = 2.62x1025 atoms
A reactor core contains 100,000 kg of uranium enriched to 3% U235. The core is 12 feet high and 12 feet in diameter. Determine the total number of U235 atoms in the core and the U235 number density, atom/cc.
gU235 = (100,000 kgU)(1,000 g/kg)(3 gU235/100 gU)

      = 3x10⁶ g U235/core

Atom U235/core = (3x10⁶ gU235/core)
                 (6.023x10²³ atom/m)/(235g/m)

      = 7.689x1027 atom/core

Vc     = πR2h

      = π(6ft)2(12 ft)

      = 1357.17 ft3

      = (1357.17 ft3)(123 in3/ft3)(2.543cc/in3)

      = 3.84x10⁷cc

N235   = (7.689x1027 atom/core)/(3.84X107 cc)

      = 2.00X10²⁰ atom/cc
Natural uranium aluminum fuel is manufactured with a 0.42 weight fraction (WF) uranium. Calculate the WF aluminum in the fuel and the atom fractions (AF) of uranium and aluminum.
WFal = 1-WFu

     = 1-0.42

     = 0.58 gAl/g fuel

Atoms U/g fuel = Au

               = WFuNa/M

               = (0.42 gU/g fuel)(6.023x10²³at/m)/
                 (238.07 gU/m)

               = 1.06x10²¹ atoms U/g fuel

Atoms Al/g fuel = Aal

                = WFalNa/M
                    = (0.58 gAl/g fuel)(6.023x10²³at/m)
                      (26.98 gAl/m)

                    = 1.29x10²² atoms Al/g fuel

AFu = Au/(Au + Aal)

     = 1.06x10²¹/(1.06x1021 + 1.29x10²²)

     = 0.076 atoms U/atom fuel

AFal = 1-AFu

      = 1-0.076

      = 0.924 atoms Al/atom fuel
Calculate the volume fractions of uranium and aluminum in example 2.3.5 (d). Compare the atom and volume fractions. What conclusion can be drawn?
VFu = (WFu/ρu)/(WFu/ρu + WFal/ρal)

     = (0.42/18.9)/(0.42/18.9 + 0.58/2.7)

     = 0.094 ccU/cc fuel

VFal = 0.906 cc Al/cc fuel
The atom fractions and volume fractions are nearly equal. That implies that large and small atoms occupy nearly the same volume in space.
A reactor generates 3,000 Mw(t) using uranium-235 fuel. Calculate the approximate uranium-235 consumption rate, g/yr. If the reactor uses 2% enriched fuel, determine the total annual uranium requirements, metric ton/yr.
E(yr) = (3000 Mw)(365 d/yr)

      = 1.095x10⁶ Mwd/yr

      = (1.095x10⁶ Mwd/yr)(24 hr/d)(3600 sec/hr)
        (106w/Mw)
                    = 9.46x10¹⁶w-sec/yr

                    = (9.46x10¹⁶w-sec/yr)(eV/1.60x10-19w-sec)

                    = 5.91x1035eV/yr

                    = (5.91x1035eV/yr)(MeV/106eV)(fission/200 MeV)

                    = 2.96x1027 fission/yr

                    = (2.96x1027 fissions/yr)
                      (1 atom U235/.85 fissions)

                    = 3.48x1027 atom U235/yr

                N = ρNa/M

                ρ = NM/Na

g U235/yr = (3.48x1027 at U235/yr)(235 g/m)/
            (6.02x10²³ at/m)

          = 1.35x10⁶ g U235/yr

ton U/yr = (1.35x10⁶ g U235/yr)(100 g U/2 g U235)

         = 6.79x10⁷gU/yr

         = (6.79x10⁷g U/yr)(kg/1000g)(ton/1000 kg)

         = 67.88 ton U/yr
The term gamma ray is normally reserved for radiation emitted by nuclei and X-ray refers to radiation originating from transitions of atomic electrons. There is no fundamental difference except that X-rays are emitted in a low energy range, 0-88KeV.
Gamma rays interact with matter in three ways: photoelectric effect, Compton effect or scattering, and pair production.
The photoelectric effect is characteristic of low energy gamma ray interactions. In the photoelectric effect the
incident gamma ray interacts with an entire atom, the gamma ray disappears, and one of the atomic electrons is ejected from the atom. The atom recoils in this process, but carries with it very little kinetic energy. The kinetic energy of the ejected photoelectron is equal, therefore, to the energy of the photon less the binding energy of the electron to the atom. The photoelectric effect is of greatest importance for heavier atoms which have a large number of electrons which are loosely bound to the atom.
Compton scattering is the elastic scattering of a gamma ray photon by an electron in which energy and momentum are conserved. Compton scattering is the dominant interaction of intermediate energy gamma rays. From a practical standpoint, the Compton effect is the cause of many difficult problems encountered in shielding gamma rays. The photon does not disappear in the interaction, but is free to interact again and again and eventually may be transmitted through a shield at some reduced energy.
Pair production is a high energy gamma phenomenon. In this process, the photon disappears and an electron pair - a positron and negatron - is created. Since the total rest mass energy of the two electrons is 2mec2 = 1.02 MeV, pair production does not occur unless the photon has at least this much energy. Above this threshold, the cross section for pair production increases steadily with increasing energy.
The total kinetic energy of the negatron-positron pair is equal to the energy of the photon less 1.02MeV. Once formed, these electrons move about and lose energy as a result of collisions with atoms in the surrounding medium. After the positron has slowed down to very low energies it combines with a negatron, the two particles disappear, and two photons are produced (annihilation radiation), each having an energy of 0.511MeV.
Figure 2.2 shows the exponential attenuation coefficient divided by density of lead as a function of gamma ray energy. In the normal energy range encountered in nuclear reactors, photoelectric effect dominates the 0 - 0.7 MeV range and Compton scattering dominates 0.7 - 2.0 MeV. Table 2.1 provides gamma ray mass attenuation coefficients - exponential attenuation coefficient divided by density - for several materials.
Describe the three types of gamma interactions.
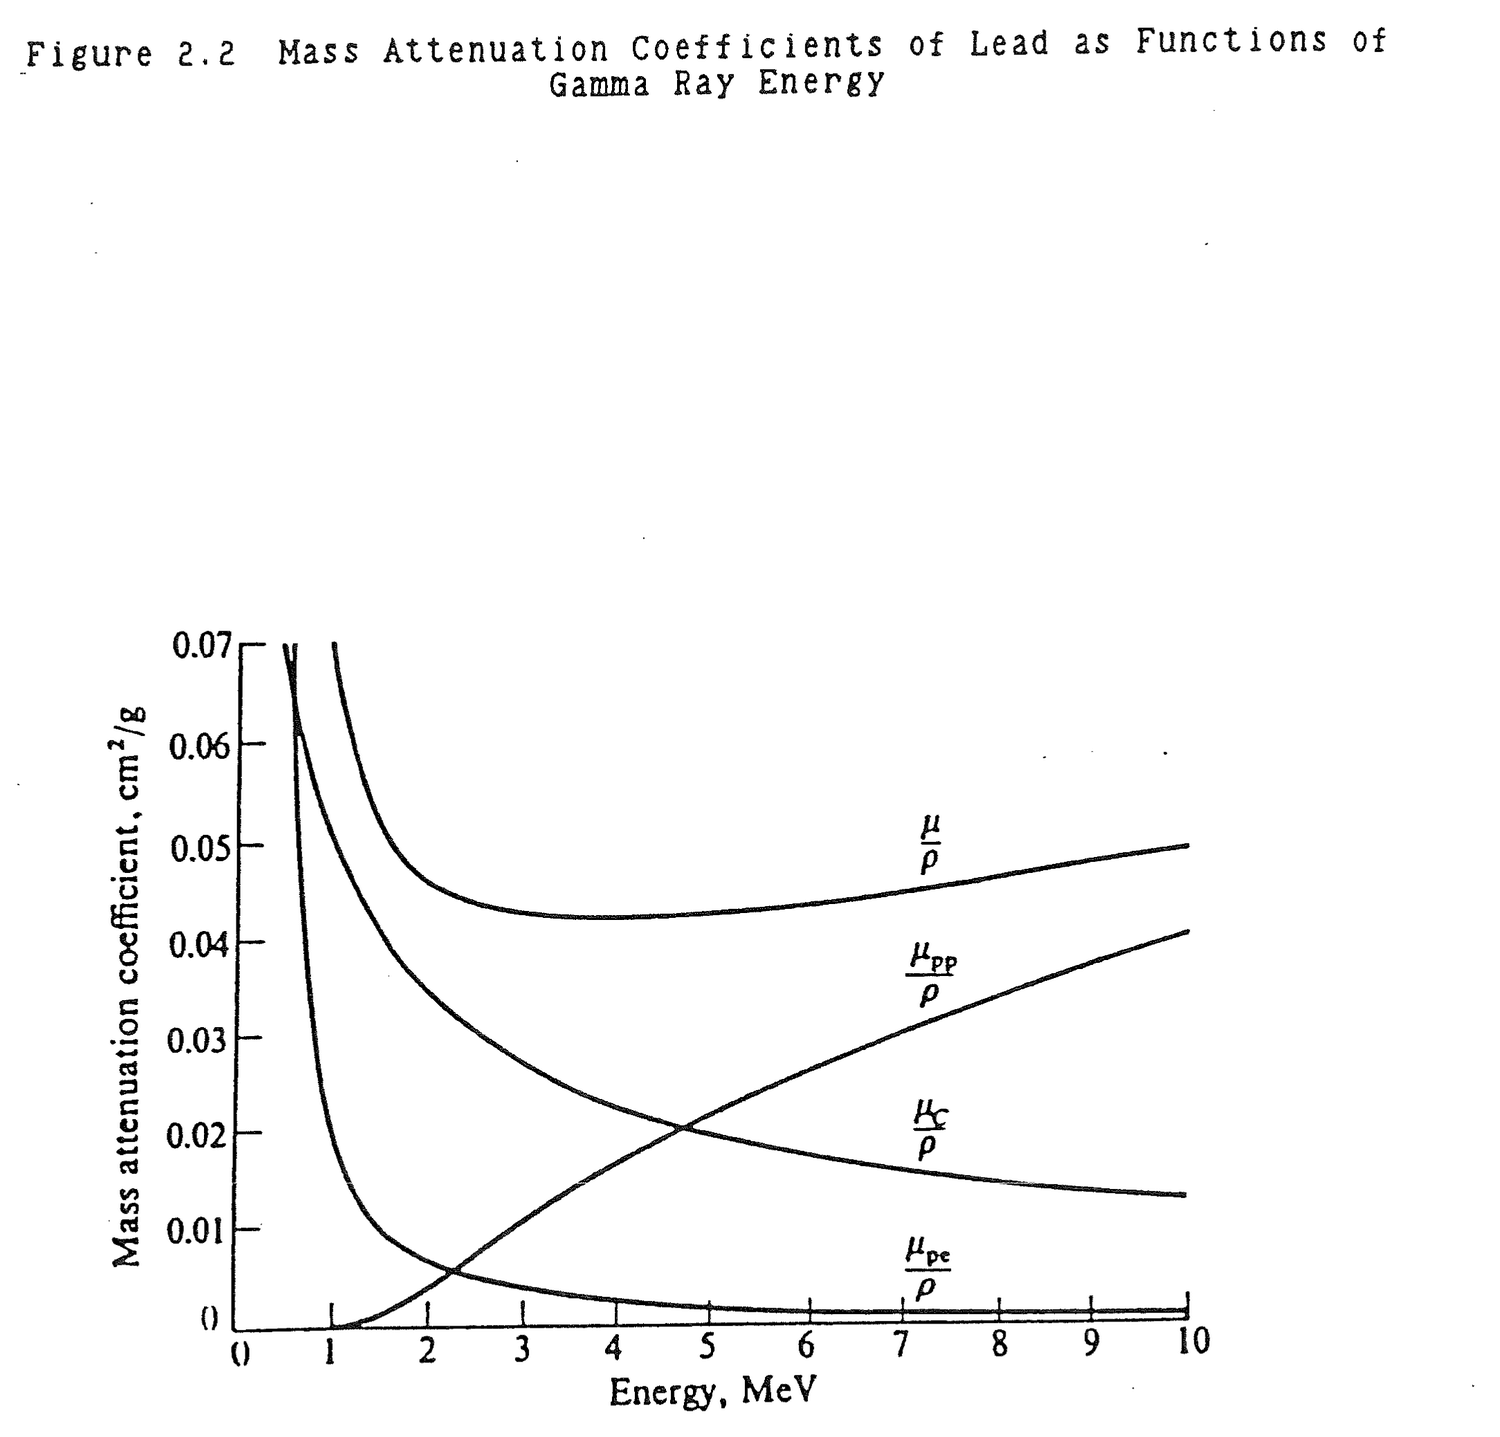
Table 2.1 Mass Attenuation Coefficients (μ/ρ) for Several Materials (cm2/gm)
                                                      Gamma-Ray Energy, MeV
Material      0.1   0.15    0.2    0.3    0.4    0.5    0.6    0.8    1.0   1.25    1.5      2      3      4      5      6      8     10

H            .295   .265   .243   .212   .189   .173   .160   .140   .126   .113   .103  .0876  .0691  .0579  .0502  .0446  .0371  .0321
Be           .132   .119   .109  .0945  .0847  .0773  .0715  .0628  .0565  .0504  .0459  .0394  .0313  .0266  .0234  .0211  .0180  .0161
C            .149   .134   .122   .106  .0953  .0870  .0805  .0707  .0636  .0568  .0518  .0444  .0356  .0304  .0270  .0245  .0213  .0194
N            .150   .134   .123   .106  .0955  .0869  .0805  .0707  .0636  .0568  .0517  .0445  .0357  .0306  .0273  .0249  .0218  .0200
O            .151   .134   .123   .107  .0953  .0870  .0806  .0708  .0636  .0568  .0518  .0445  .0359  .0309  .0276  .0254  .0224  .0206

Na           .151   .130   .118   .102  .0912  .0833  .0770  .0676  .0608  .0546  .0496  .0427  .0348  .0303  .0274  .0254  .0229  .0215
Mg           .160   .135   .122   .106  .0944  .0860  .0795  .0699  .0627  .0560  .0512  .0442  .0360  .0315  .0286  .0266  .0242  .0228
Al           .161   .134   .120   .103  .0922  .0840  .0777  .0683  .0614  .0548  .0500  .0432  .0353  .0310  .0282  .0264  .0241  .0229
Si           .172   .139   .125   .107  .0954  .0869  .0802  .0706  .0635  .0567  .0517  .0447  .0367  .0323  .0296  .0277  .0254  .0243
P            .174   .137   .122   .104  .0928  .0846  .0780  .0685  .0617  .0551  .0502  .0436  .0358  .0316  .0290  .0273  .0252  .0242

S            .188   .144   .127   .108  .0958  .0874  .0806  .0707  .0635  .0568  .0519  .0448  .0371  .0328  .0302  .0284  .0266  .0255
Ar           .188   .135   .117  .0977  .0867  .0790  .0730  .0638  .0573  .0512  .0468  .0407  .0338  .0301  .0279  .0266  .0248  .0241
K            .215   .149   .127   .106  .0938  .0852  .0786  .0689  .0618  .0552  .0505  .0438  .0365  .0327  .0305  .0289  .0274  .0267
Ca           .238   .158   .132   .109  .0965  .0876  .0809  .0708  .0634  .0566  .0518  .0451  .0376  .0338  .0316  .0302  .0285  .0280
Fe           .344   .183   .138   .106  .0919  .0828  .0762  .0664  .0595  .0531  .0485  .0424  .0361  .0330  .0313  .0304  .0295  .0294

Cu           .427   .206   .147   .108  .0916  .0820  .0751  .0654  .0585  .0521  .0476  .0418  .0357  .0330  .0316  .0309  .0303  .0305
Mo           1.03   .389   .225   .130  .0998  .0851  .0761  .0648  .0575  .0510  .0467  .0414  .0365  .0349  .0344  .0344  .0349  .0359
Sn           1.58   .563   .303   .153   .109  .0886  .0776  .0647  .0568  .0501  .0459  .0408  .0367  .0355  .0355  .0358  .0368  .0383
I            1.83   .648   .339   .165   .114  .0913  .0792  .0653  .0571  .0502  .0460  .0409  .0370  .0360  .0361  .0365  .0377  .0394
W            4.21   1.44   .708   .293   .174   .125   .101  .0763  .0640  .0544  .0492  .0437  .0405  .0402  .0409  .0418  .0438  .0465

Pt           4.75   1.64   .795   .324   .191   .135   .107  .0800  .0659  .0554  .0501  .0445  .0414  .0411  .0418  .0427  .0448  .0477
Tl           5.16   1.80   .866   .346   .204   .143   .112  .0824  .0675  .0563  .0508  .0452  .0420  .0416  .0423  .0433  .0454  .0484
Pb           5.29   1.84   .896   .356   .208   .145   .114  .0836  .0684  .0569  .0512  .0457  .0421  .0420  .0426  .0436  .0459  .0489
U           10.60   2.42   1.17   .452   .259   .176   .136  .0952  .0757  .0615  .0548  .0484  .0445  .0440  .0446  .0455  .0479  .0511
Air          .151   .134   .123   .106  .0953  .0868  .0804  .0706  .0655  .0567  .0517  .0445  .0357  .0307  .0274  .0250  .0220  .0202

NaI          1.57   .568   .305   .155   .111  .0901  .0789  .0657  .0577  .0508  .0465  .0412  .0367  .0351  .0347  .0347  .0354  .0366
H2O          .167   .149   .136   .118   .106  .0966  .0896  .0786  .0706  .0630  .0575  .0493  .0396  .0339  .0301  .0275  .0240  .0219
Concrete     .169   .139   .124   .107  .0954  .0870  .0804  .0706  .0635  .0567  .0517  .0445  .0363  .0317  .0287  .0268  .0243  .0229
Tissue       .163   .144   .132   .115   .100  .0936  .0867  .0761  .0683  .0600  .0556  .0478  .0384  .0329  .0292  .0267  .0233  .0212
Photoelectric Effect - Low energy (0-0.7 MeV). Gamma ray gives up all its energy to an atom and an atomic electron is ejected.
Compton Scattering - Medium energy (0.7-2.0 Mev). Elastic scattering of a gamma ray by an electron. A reduced energy gamma results.
Pair Production - High Energy (>2.0 MeV). Gamma ray disappears and produces a positive and negative electron pair.
What is the minimum energy gamma required for pair production?
Emin = 2 mec2

     = 2(9.11x10⁻²⁸g)(3.00x1010cm/sec)2

     = 1.64x10⁻⁶gm cm2/sec2

     = 1.64x10⁻⁶ erg

     = (1.64x10⁻⁶ erg)(eV/1.60x10-12erg)(MeV/106eV)

     = 1.022 MeV
Which is the better shield for 1.0 MeV gamma rays, 10 g of aluminum or 10 g of lead assuming they are similarly configured?
                                    Aluminum    Lead

μ/ρ        (cm2/g)  Table 2.1      .0614       .0684

ρ          (g/cm3)  Table 2.3      2.70        11.35

μ          (1/cm)   (μ/ρ)(ρ)       .166        .776

m          (g)                     10          10

(μ/ρ)(m)  cm2                        .614        .684
Per g of mass (μ/ρ) aluminum and lead attenuate 1.0 Mev gammas almost equally because gamma
attenuation depends on the number of electrons present. Aluminum has less electrons, but more atoms. Lead has more electrons but few atoms. Lead is slightly better because it has more loosely bound electrons. The linear attenuation coefficient, μ, of lead is much greater because one cm of lead contains more mass and more electrons than one cm of aluminum. The term (μ/ρ)(m) is in units of cm2 and is analogous to microscopic cross section for neutrons.
Because alpha particles are so massive, they are only slightly deflected when they interact with atomic electrons. They move almost in straight lines as they travel in a medium. As an alpha particle slows down, it tends to pick up one electron to become a helium ion and then capture another to become a neutral helium atom. The distance at which alpha ionization falls to zero is called the range of the alpha particle. The range increases with increasing alpha energy, but in most materials, it is very short, about .002 cm in solids and 0.4 cm in air.
What happens to an alpha particle as it enters a material?
The alpha particle gives up kinetic energy to electrons as it travels through a medium. The alpha ion picks up two electrons and becomes neutral helium.
(2α4)+2 + -1β0 --> (2α4)+1

(2α4)+1 + -1β0 --> 2He4
Beta particles collide with atomic electrons, but being much less massive than alpha particles, they are more strongly deflected with each interaction. As a result, betas move in complicated zigzag paths. It has been found experimentally that beta particles attenuate exponentially with distance into an absorber. As with alpha particles, beta particles are stopped by fractions of a centimeter of solid materials, but in air, beta range can be quite large depending upon the initial beta energy as can be seen in Figure 2.3

What are the ranges, m, of 1, 2, 3, and 4 MeV beta particles in air?
Energy                         Range (Figure 2.3)
(MeV)                                 (m)

  1                                    4
  2                                    8
  3                                   13
  4                                   18
Once formed, fission fragments rip through the electron cloud of the original fissioning nucleus as they pass into the surrounding medium. In so doing, they usually pick up a number of electrons, although never enough to form a neutral atom. The virgin fission fragment thus appears as a highly energetic and highly ionized atom. The average charge is approximately +20e.
Because of their charge, the specific ionization due to fission fragments is very high and their range is correspondingly short. Table 2.2 gives approximate ranges of the lighter, more energetic, and hence more penetrating fragments in various materials.
What happens to a fission fragment after it is formed?
The average fission fragment is produced with a great deal of kinetic energy, 80-90 MeV, and a charge of +20e. As it travels through fuel and clad, it gives up its kinetic energy to electrons, produces much ionization, and gradually picks up 20 electrons to become a neutral atom.
It is important to recognize at the outset that since neutrons are electrically neutral, they are not affected by the electrons in an atom or by the positive charge of the nucleus. As a result, neutrons pass through the atomic electron cloud and interact directly with the nucleus. In short, neutrons collide with nuclei, not with atoms. Neutrons may interact with nuclei in one or more of the following ways:
Table 2.2 Ranges of Fission Fragments
Medium                        Range, 10-3cm

Aluminum                            1.4
Copper                              0.59
Silver                              0.53
Uranium oxide (U3O8)              1.4
1. Elastic scattering. In this process, the neutron strikes the nucleus, which is almost always in its ground state energy, the neutron reappears, and the nucleus is left in its ground state. The neutron in this case is said to have been elastically scattered by the nucleus. In the notation of nuclear reactions, this interaction is abbreviated by the symbol (n,n).
2. Inelastic scattering. This process is identical to elastic scattering except that the nucleus is left in an excited state. Inelastic scattering is denoted by the symbol (n,n'). The excited nucleus decays by the emission of gamma rays. In this case, since these gamma rays originate in inelastic scattering, they are called inelastic gamma rays.
3. Radiative capture. A neutron is captured by a nucleus, and one or more gamma rays - called capture gammas- are emitted. This reaction is denoted by (n,γ). Since the original neutron is absorbed, this process is an example of a class of interactions known as absorption reactions.
4. Charged particle reactions. Neutrons may also disappear as the result of absorption reactions of the type (n,α) and (n,p).
5. Neutron producing reactions. Reactions of the type (n,2n) and (n,3n) occur with energetic neutrons. The (n,2n) reaction is especially important in reactors containing heavy water or beryllium since 2H and 9Be have loosely bound neutrons which can easily be ejected.
6. Fission. Neutrons colliding with certain nuclei may cause the nuclei to split apart, i.e., undergo fission. This reaction is the principal source of nuclear energy for practical applications.
Describe the dominant types of interactions of each type of radiation.
Radiation                  Interact with:

Gamma                      Electron
Electron                   Electron
Alpha                      Electron
Fission Fragment           Electron
Neutron                    Nucleus
Which type of radiation is most damaging to reactor materials?
Fast neutrons displace metal atoms in crystalline structure increasing brittleness, reducing impact strength, and producing swelling.
Describe elastic and inelastic scattering.
Elastic Scattering - A neutron enters a ground state nucleus, imparts kinetic energy to the nucleus, and leaves the nucleus in ground state.
Inelastic Scattering - A neutron enters a ground state nucleus, imparts kinetic energy to the nucleus, and leaves the nucleus in an excited state. The nucleus subsequently decays by gamma emission, called isomeric transition, to ground state.
Write equations to illustrate the following commom neutron interactions: (n,n), (n,n'), (n,gamma), (n,β), (n,α), (n,p), and fission.
(n,n)     1H1 + 0n1 --> 1H1 + 0n1   Elastic Scattering

(n,n')    6C12 + 0n1 --> 6C12* + 0n1   Inelastic
                                                Scattering

          6C12* --> 6C12 + 0γ0

(n,gamma)  45Rh103 + 0n1 --> 45Rh104 + 0γ0

(n,β)     27Co59 + 0n1 --> 27Co60 --> 28Ni60 + -1β0 +

          0γ0(1.174) + 0γ0(1.332)

(n,α)     5B10 + 0n1 --> 3Li7 + 2α4

(n,p)     8O16 + 0n1 --> 7N16 + 1p1

Fission   92U235 + 0n1 --> 55Cs135 + 39Y98 + 30n1 +

          2-1β0 + 0γ0
Radioactive decay is the spontaneous breakup of an unstable nucleus; alpha particles, beta particles, gamma rays, and sometimes neutrons are emitted in the process. The emission of either alpha or beta particles changes the identity of the nucleus because in each instance there is a loss in nuclear charge. The emission of a gamma ray simply reduces the energy level of the nucleus, since there is no loss of charge or mass. Emission of a neutron produces a different isotope of the same element. All nuclides with atomic numbers greater than 82 are naturally radioactive and go through radioactive decay. In a reactor, most radioactive elements result from absorption of a neutron by a stable nucleus.
Figure 2.4 shows the decay scheme for radioactive cobalt-60. Cobalt-60 is formed by thermal neutron capture in the nucleus of stable cobalt-59. Cobalt-60 decays by beta and gamma ray emission. The reaction is called an (n,β) type. When cobalt-59 absorbs a neutron, excited cobalt-60 is formed. The excited nucleus undergoes isomeric transition (IT) by emitting a 58.6 keV gamma ray down to the cobalt-60 ground state, greater than 99% of the time. Cobalt-60 decays, greater than 99% of the time, by beta emission and with the emission of a total gamma energy of 2.506 MeV to nickel-60. The beta decay forms excited nickel-60. First, the nickel-60 emits a 1.17 MeV gamma to reduce its excitation level from 2.506 MeV to 1.332 MeV. Then it emits [illegible] second gamma ray of 1.332 MeV to reduce the nucleus to ground state energy.
Mathematically, radioactive decay can be represented by the first order, linear differential equation
dA/dt = -λA (2.5)
where A is the number density of radioactive atoms of a substance and λ is called the decay constant. The product, λA, is the decay rate of a radioactive material in disintegrations per second (dps). Activity is measured in units of curies where one curie, denoted as Ci, is exactly 3.7x10¹⁰ disintegrations or decay events per second. Small amounts of activity are measured in microcuries, denoted μCi, which are 10-6 Ci or 3.7x10⁴ disintegrations per second. The decay constant is in units of inverse seconds. The minus sign accounts for the fact that radioactive substances diminish with time.
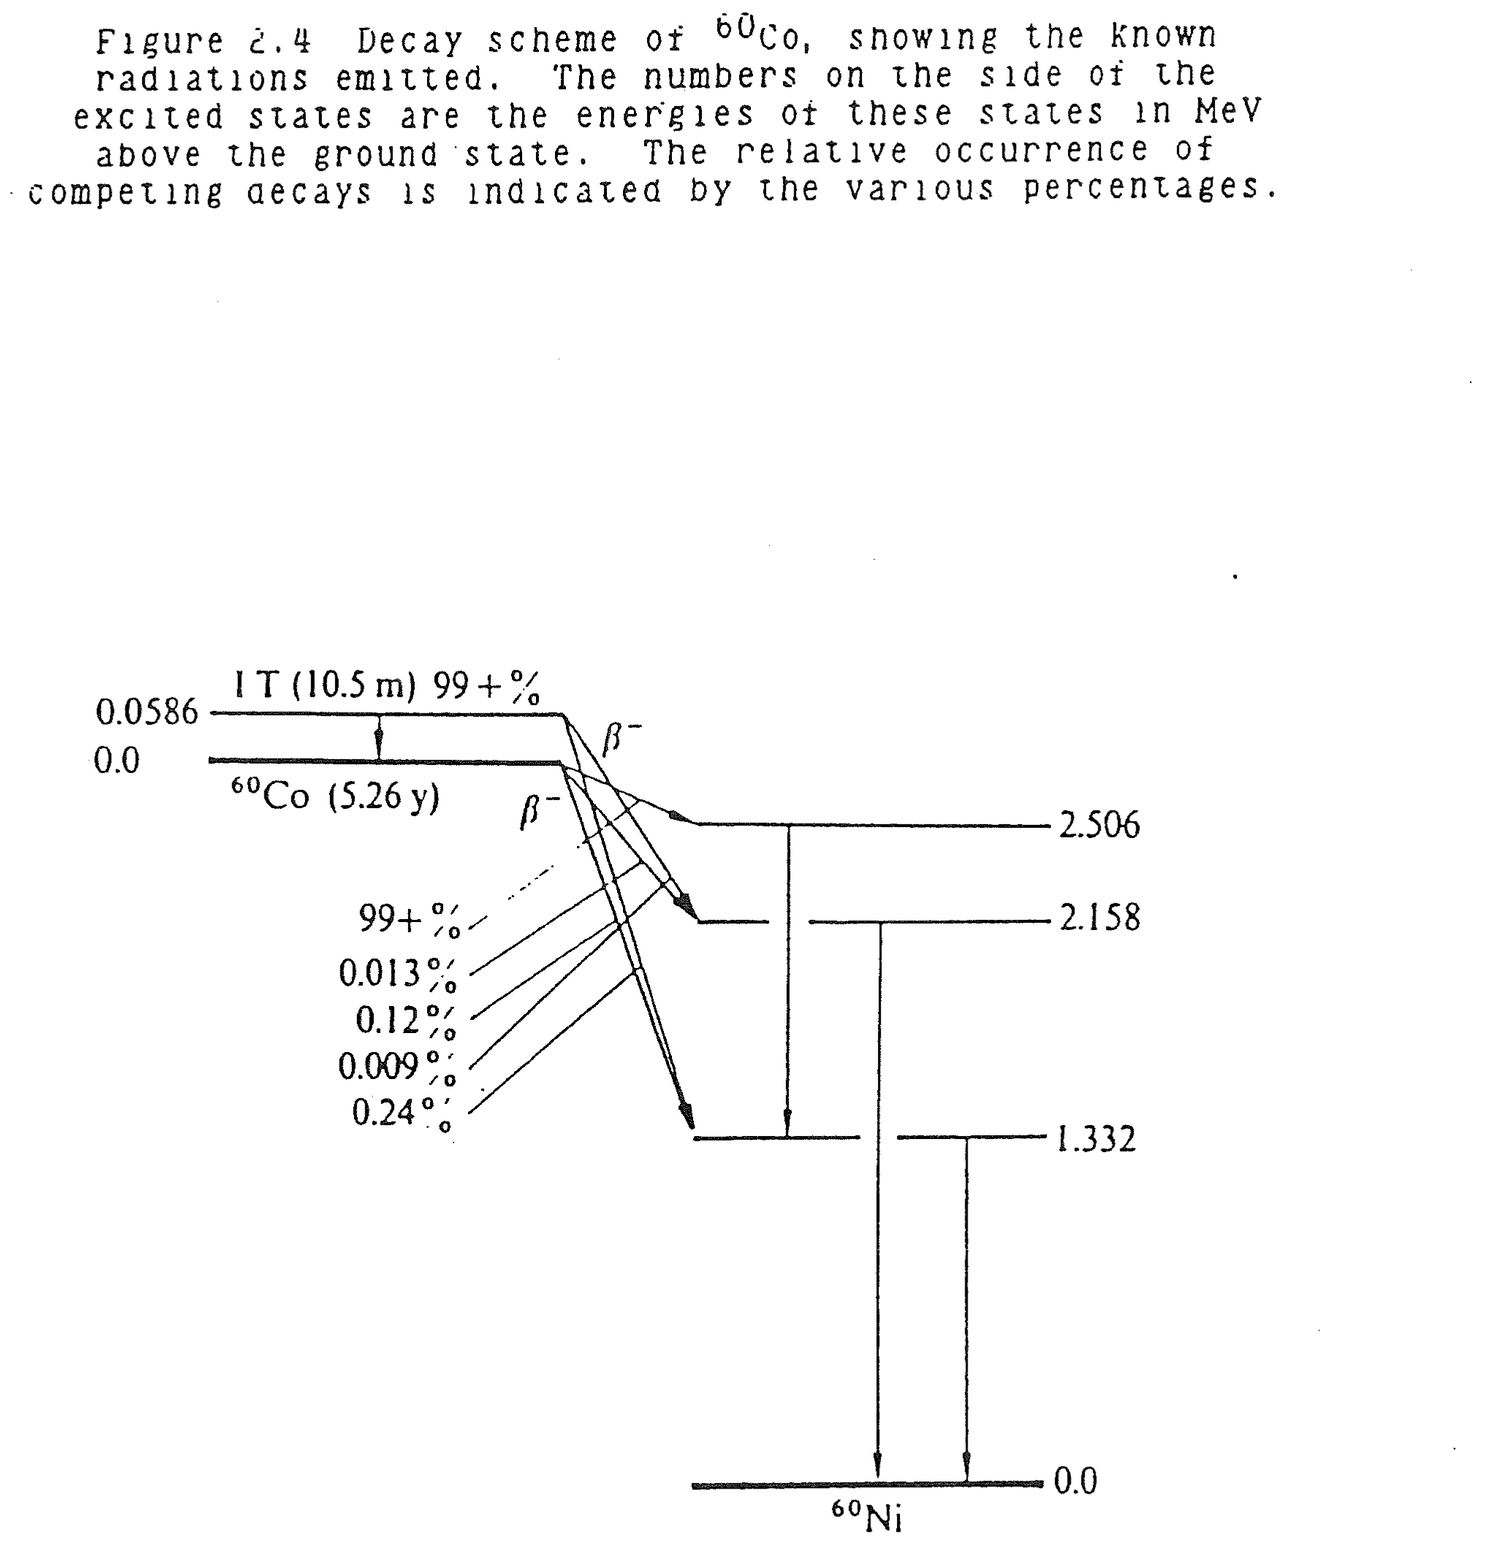
The exact solution to equation (2.5) is
A(t) = A(o)e-λt (2.6)
which shows that radioactive substances decay exponentially with time.
Radioactive half-life, T2, is the time required for a given amount of activity to decay by a factor of 2. Half-life is easily measured while decay constant is not. Equation (2.6) allows a determination of λ in terms of half-life. In time, t = T2, A(T2) = 1/2A(0).
1/2A(0) = A(0)e-λT2

1/2 = e-λT2                                                        (2.7)

2 = eλT2

ln2 = λT2

λ = ln2/T2                                                         (2.8)
Thus, equation (2.6) becomes
A(t) = A(o)e-.693t/T2 (2.9)
An exact radioactivity can be calculated from a known starting activity and half-life at any decay time.
If half-life is known, radioactive decay can be determined more easily with less probability of error, from a linear tabulation as follows:
Time                          Radioactivity

 0                                (0)
 T2                               ½A(0)
2T2                        (½)(½)A(0) = 1/4 A(0)
3T2                        (½)3A(0) = 1/8 A(0)
4T2                        (½)4A(0) = 1/16 A(0)
 .                                  .
 .                                  .
 .                                  .
 .                                  .
 .                                  .
 .                                  .
nT2                          (½)nA(0)
Some specific examples of radioactive decay are:
Alpha:      94PU239 --> 2He4 + 92U235

Beta:       82Pb209 --> -1β0 + 83Bi209

Gamma:      40Zr95 --> 0γ0 + 40Zr95

Neutron:    36Kr87 --> 0n1 + 36Kr86
Define an element.
An element is an atom with a fixed number of protons in the nucleus.
Define an isotope.
An isotope is an atom with a fixed number of protons and neutrons in the nucleus. An element has several isotopes.
Is there an upper limit to the mass number of stable elements?
All elements above mass number 82(lead) are naturally radioactive.
An element decays at a rate of 10% per day. Determine its half-life.
A = A0e-λt

  = A0e-.693/T2

0.9A0 = A0e-.693/T2

0.9 = e-.693/T2

ln 0.9 = -.693/T2
T2 = -.693/ln 0.9

   = -.693/-.105

   = 6.6d

   = 158.4 hr
When radioactive material was removed from a reactor core, it read 25 rem/hr. Five hours later, it read 1.5 rem/hr.
(a) What is the materials half-life?
D = Doe-.693t/T2

1.5 = 25 e-(.693)(5)/T2

T2 = (-.693)(5)/ln(1.5/25)

   = 1.23 hr.
(b) How long will it take the sample to decay away to 200 mrem/hr?
Time                    Dose Rate
(hr)                    (mrem/hr)

0                        25,000
5                         1,500
6.23                        750
7.46                        375
8.69                        188   (approximately 200)

200 = 25,000 e-.693t/1.23

  t = 1.23 ln(200/25,000)/(-.693)

    = 8.57 hr
Assume a 10 curie point source of 2MeV gammas:
(a) Determine the dose rate at 10 feet from the source with no intervening shielding.
D = 6C(ci)E(MeV)n(#gamma)/r(ft)2

  = 6(10)(2)(1)/(10)2

  = 1.2 rem/hr
(b) Assume the source has a 30 minute half-life. What is the source strength two hours from the time it was 10 curies?
Time                    Activity
(hr)                      (Ci)

0                       10
0.5                      5
1.0                      2.5
1.5                      1.25
2.0                      0.625
(c) How many half-thicknesses of lead placed 10 feet from the source would be necessary to reduce the initial radiation field to 50 mrem/hr?
D = Doe-.693X/X2

50 = 1200e-.693(X/X2)

X/X2 = ln (50/1200)/(-.693)

     = 4.59
A mixed beta-gamma point source measures 100 mrem/hr at one foot and 0.1 mrem/hr at 10 feet. What are the fractions of betas and gammas in the source?
At 10 feet, all measured radiation is from gammas.
D1r12 = D10r102

D1(1)2 = 0.1(10)2

    D1 = 10 mrem/hr gamma

D (beta) = D(total)-D1

         = 100-10

         = 90 mrem/hr beta

Dose Fractions = 10% gamma and 90% beta
The effective target area in cm2 presented by a single nucleus to an incident neutron beam is denoted the microscopic cross section, σ. The microscopic cross section is more commonly defined in barns where 1 barn = 10-24cm2.
There are two primary types of reactions between neutrons and nuclei: (1) absorption (σa) in which a neutron enters a nucleus and other particles or photons leave the nucleus; and (2) scattering (σs) in which a neutron enters a nucleus, may transfer some of its energy to the nucleus, and exits the nucleus as a free neutron. Absorption is also referred to as capture. Capture can have differing results. For example, when a thermal neutron is captured by a U235 nucleus, 85% of the time fission (σf) results and 15% of the captures result in gamma emission (σc) from the excited U236 nucleus but no fission.
The microscopic cross section values given in a chart of nuclides are for a specific neutron energy, .0253eV. This is the neutron energy that corresponds to the peak values of thermal flux in a reactor at ambient temperature.
Microscopic cross section varies with energy. Figure 2.5 is a plot of the cross section of boron-10 versus energy. Every isotope has a distinct cross section, but the B10 cross section can be used to reveal some generalities. In the thermal energy range, approximately 0 - 1eV, the B10 cross section decreases as energy increases. The rate of decrease is inversely proportional to √E. Since the chart of nuclides cross section at .0253eV is 3838 barns, the cross section at any other energy in the thermal range is
σE = 3838 √.0253/E (2.10)
For example, at .06eV
σ.06 = 3838 √.0253/.06

     = 2492 barns
In the intermediate or epithermal energy range, 1 eV - 100KeV, relatively high peak values occur in the cross section. These are called resonance peaks and represent strong desire on the part of a nucleus to absorb neutrons of the resonance energy value. The absorption of a neutron with resonance energy puts the nucleus in a more stable energy state.
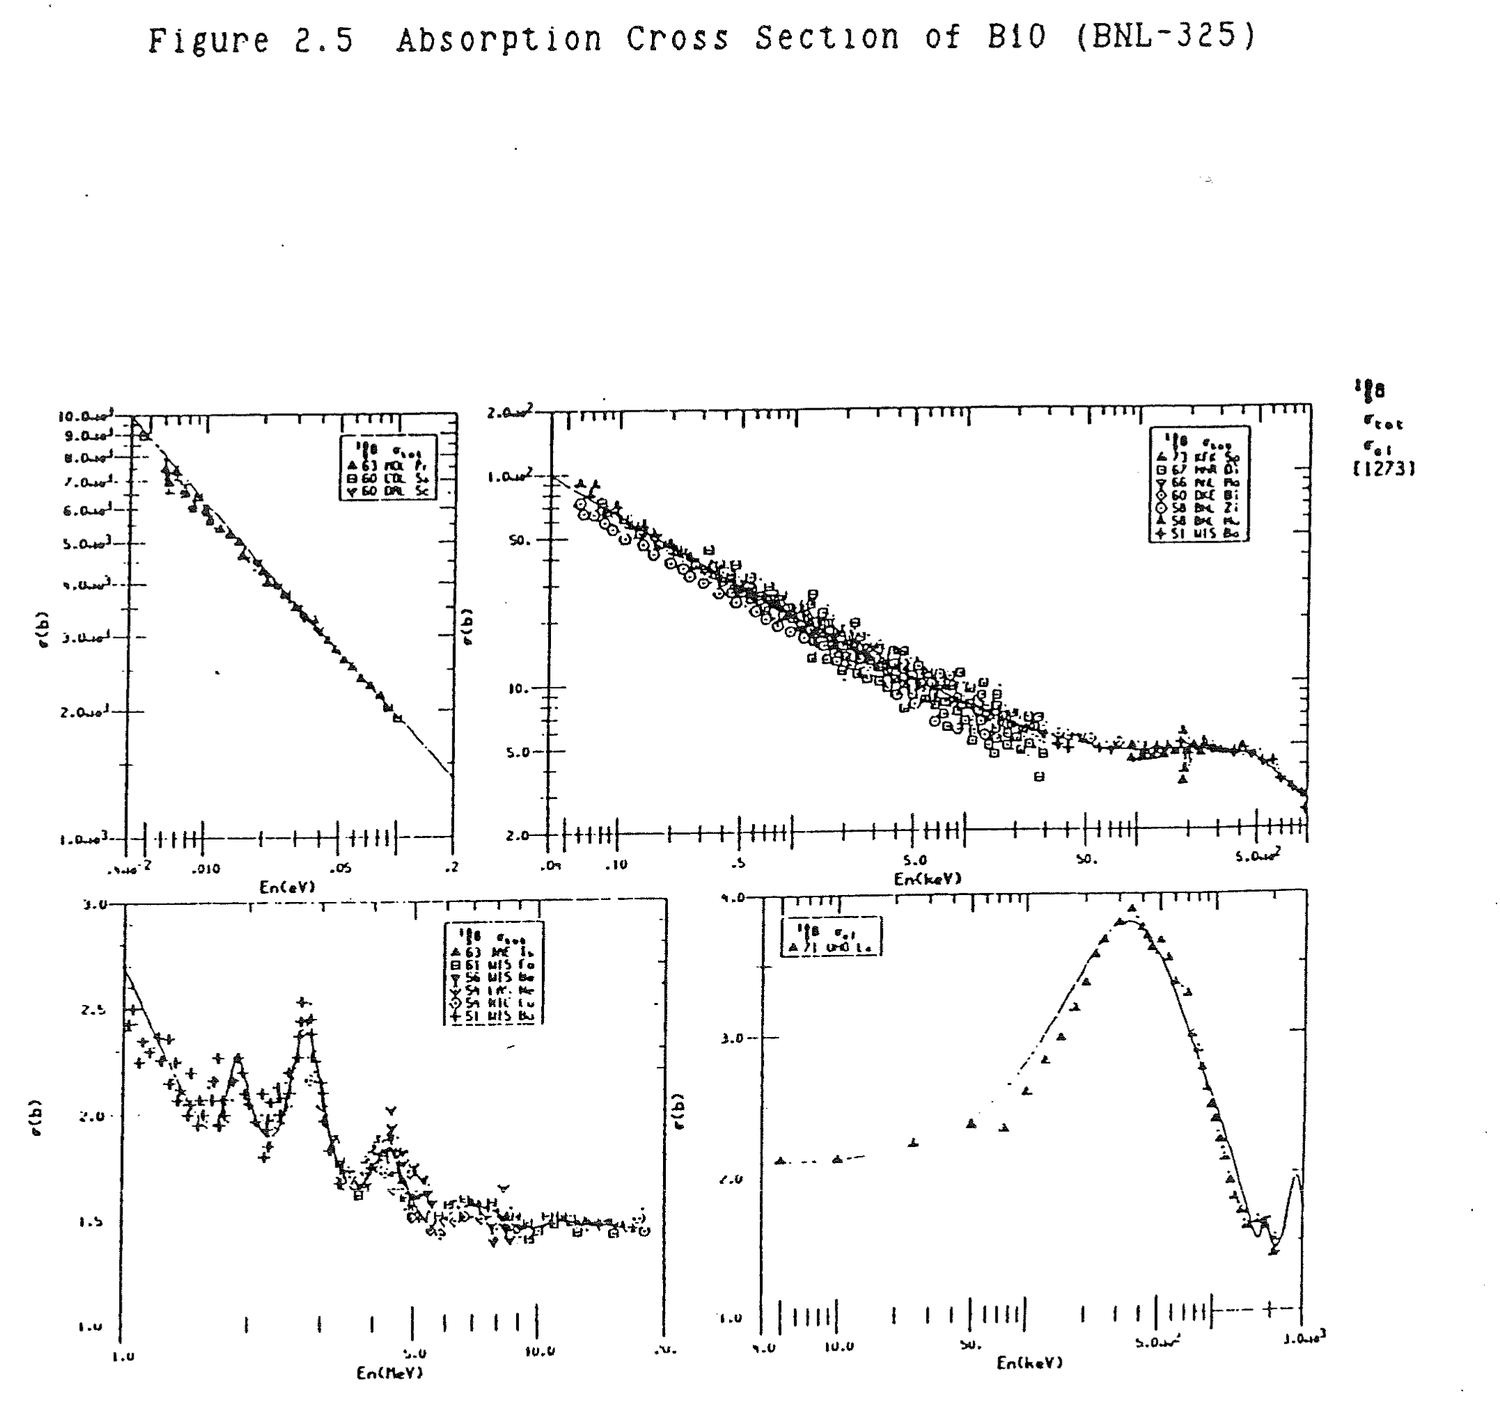
In the fast energy range, 100KeV - 10MeV, cross section is inversely proportional to energy, that is, cross section decreases linearly as energy increases.
Figure 2.6 is a plot of U235 fission cross section versus energy. The general shape and characteristics of the cross section are similar to those for B10. Microscopic scattering and absorption cross sections are listed in Table 2.3.
Calculate the approximate geometric cross sectional areas of hydrogen, boron, and uranium nuclei.
Hydrogen     AH = πRH2

                = π(1.25x10⁻¹³cm)2

                = 4.91x10⁻²⁶cm2

                = .0491x10-24cm2

                = .0491 barns

Boron        AB = π(2.74x10⁻¹³cm)2

                = 0.235x10⁻²⁴cm2

                = 0.235 barns

Uranium      AU = π(7.61x10⁻¹³cm)2

                = 1.82x10⁻²⁴cm2

                = 1.82 barns
Boron-10 is a 1/v absorber which means the microscopic cross section is inversely proportional to neutron velocity or inversely proportional to the square root of energy. Calculate the boron 10 cross sections at 0.1eV.
σ0.1/σ0.0253 = √0.0253/0.1

σ0.1 = 3838√0.0253/0.1

      = 1930 barns

      = 1930x10-24cm2
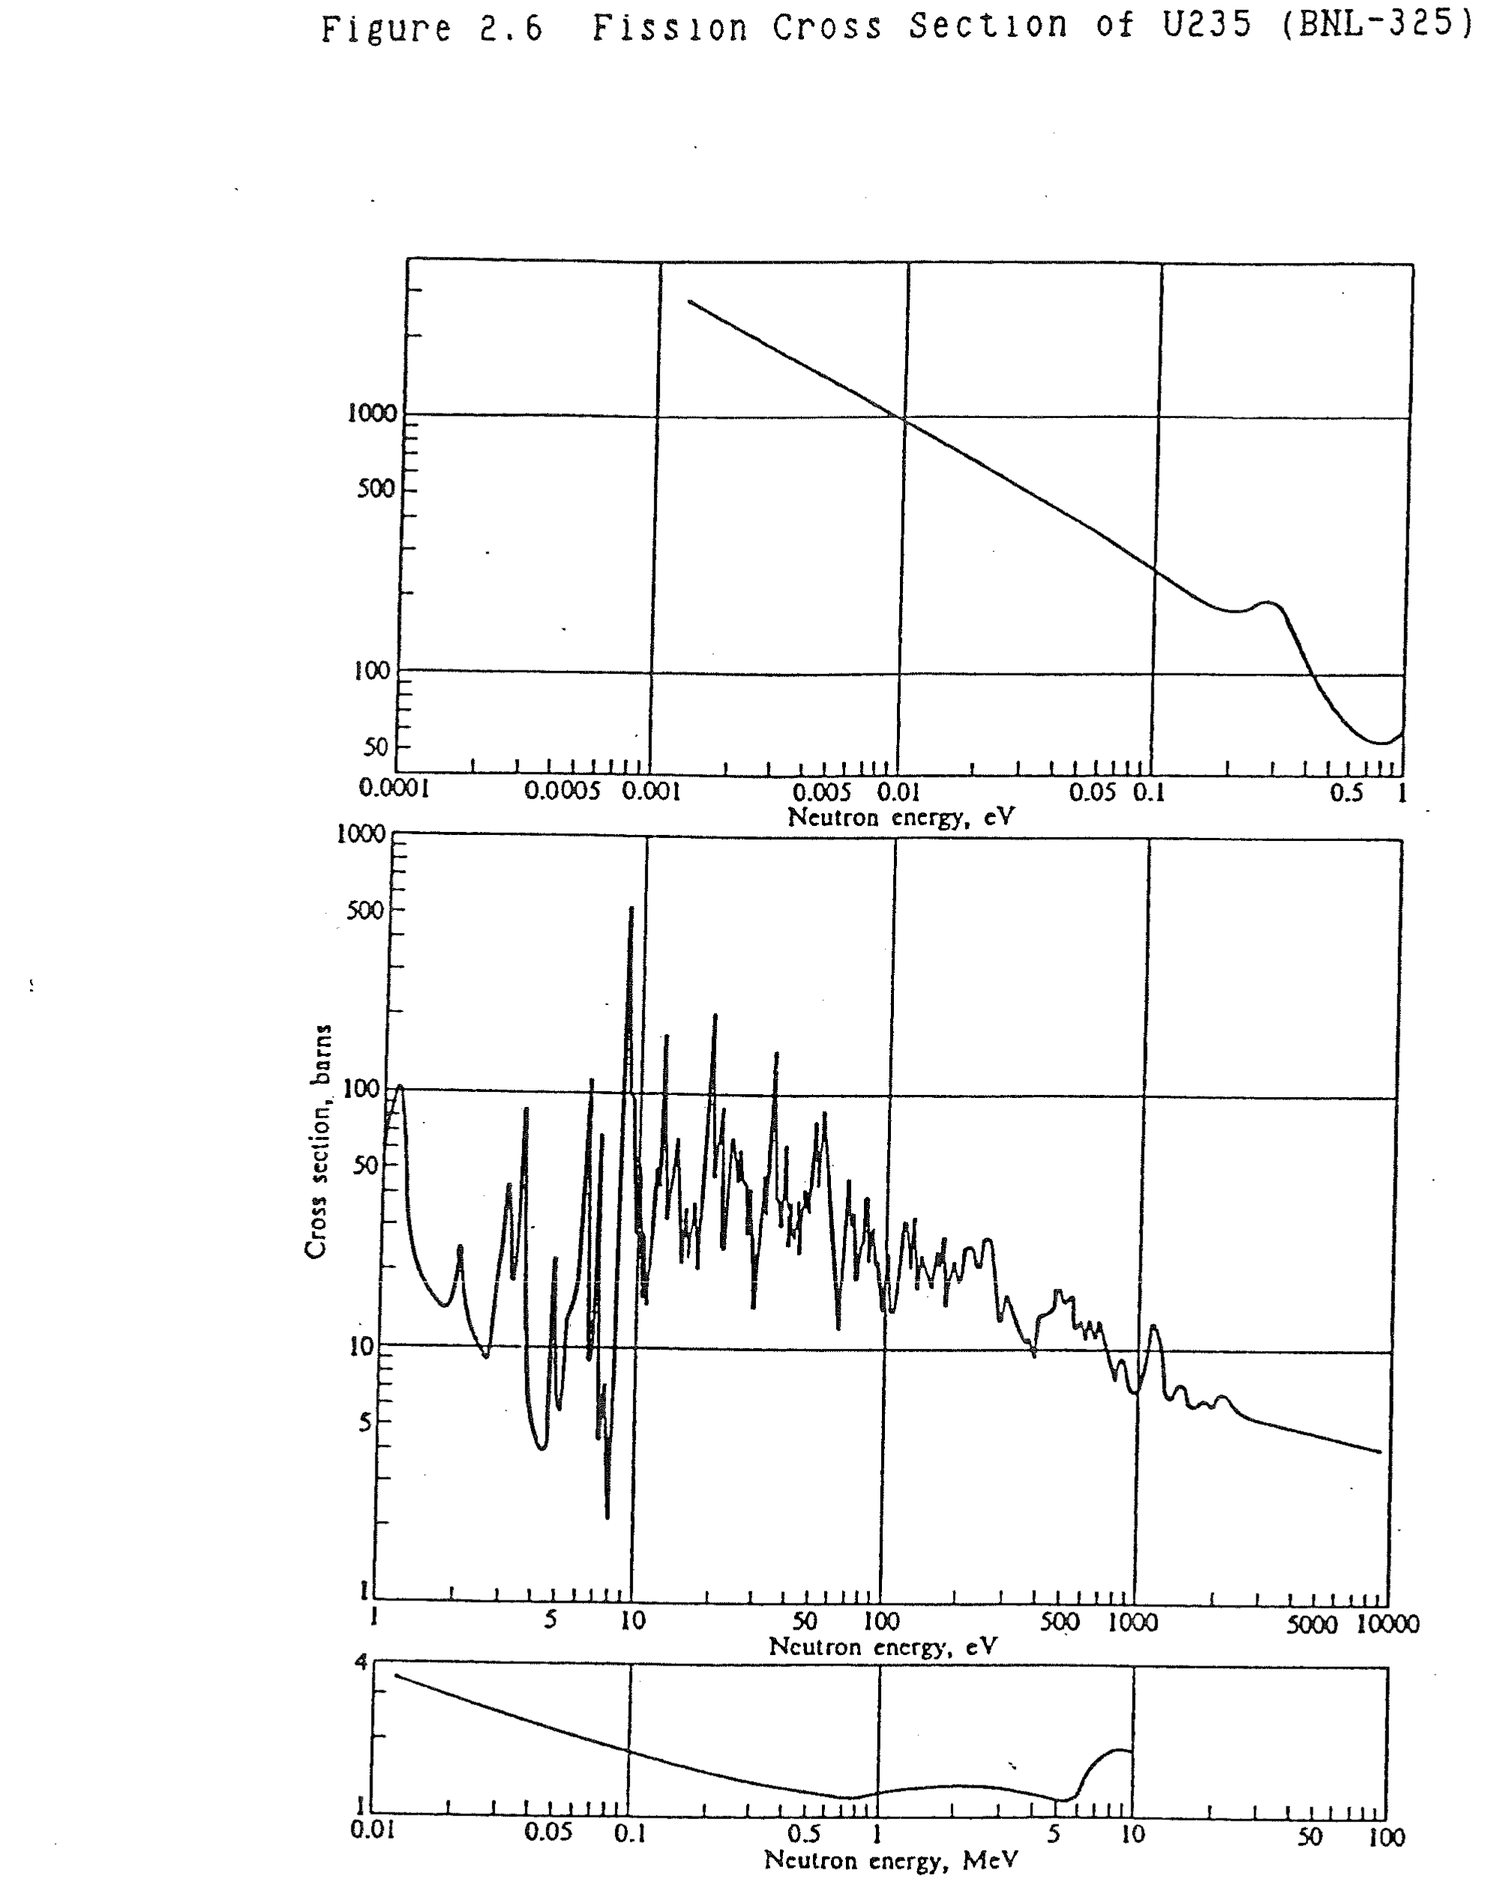
Table 2.3 Cross Sections of Naturally Occurring Elements
Atomic  Element   Atomic   Density,  Nuclei per          Microscopic Cross  Macroscopic Cross
No.     or        or       g/cm3     Unit Vol.     ξ     Section, barns     Section, cm-1
        Compound  Mol. Wt.           × 10-24                σa      σs     Σa      Σs

1     H         1.008    8.9a     5.3a      1.000    0.33    38     1.7a    0.00[illegible]
      H2O       18.016   1        0.0335b   0.948    0.66    103    0.022   3.45
      D2O       20.030   1.10     0.0331b   0.570    0.001   13.6   3.3a    0.44[illegible]
2     He        4.003    17.8a    2.6a      0.425    0.007   0.8    0.02a   2.1a
3     Li        6.940    0.534    0.0463    0.268    71      1.4    3.29    0.065
4     Be        9.013    1.85     0.1236    0.209    0.010   7.0    124a    0.86[illegible]
      BeO       25.02    3.025    0.0728b   0.173    0.010   6.8    73a     0.501
5     B         10.82    2.45     0.1364    0.171    755     4      103     0.346
6     C         12.011   1.60     0.0803    0.158    0.004   4.8    32a     0.385
7     N         14.008   0.0013   5.3a      0.136    1.88    10     9.9a    50a
8     O         16.000   0.0014   5.3a      0.120    20a     4.2    0.000   21a
9     F         19.00    0.0017   5.3a      0.102    0.01    3.9    0.05a   20a
10    Ne        20.183   0.0009   2.6a      0.0968   <2.8    2.4    7.3a    6.2a
11    Na        22.991   0.971    0.0254    0.0845   0.525   4      0.013   [illegible]
12    Mg        24.32    1.74     0.0431    0.0811   0.069   3.6    0.003   [illegible]
13    Al        26.98    2.699    0.0602    0.0723   0.241   1.4    0.015   0.084
14    Si        28.09    2.42     0.0522    0.0698   0.16    1.7    0.008   0.089
15    P         30.975   1.82     0.0354    0.0632   0.20    5      0.007   0.177
16    S         32.066   2.07     0.0389    0.0612   0.52    1.1    0.020   0.043
17    Cl        35.457   0.0032   5.3a      0.0561   33.8    16     0.002   80a
18    Ar        39.944   0.0018   2.6a      0.0492   0.66    1.5    1.7a    3.9
19    K         39.100   0.87     0.0134    0.0504   2.07    1.5    0.028   0.020
20    Ca        40.08    1.55     0.0233    0.0492   0.44    3.0    0.010   0.070
21    Sc        44.96    2.5      0.0335    0.0438   24      24     0.804   0.804
22    Ti        47.90    4.5      0.0506    0.0411   5.8     4      0.328   0.226
23    V         50.95    5.96     0.0704    0.0387   5       5      0.352   0.352
24    Cr        52.01    7.1      0.0822    0.0385   3.1     3      0.255   0.247
25    Mn        54.94    7.2      0.0789    0.0359   13.2    2.3    1.04    0.181
26    Fe        55.85    7.86     0.0848    0.0353   2.62    11     0.222   0.933
27    Co        58.94    8.9      0.0190    0.0335   38      7      3.46    0.637
28    Ni        58.71    8.90     0.0913    0.0335   4.6     17.5   0.420   1.60
Table 2.3 Cross Sections of Naturally Occurring Elements (continued)
Atomic  Element   Atomic   Density,  Nuclei per          Microscopic Cross  Macroscopic Cross
No.     or        or       g/cm3     Unit Vol.     ξ     Section, barns     Section, cm-1
        Compound  Mol. Wt.           × 10-24                σa      σs     Σa      Σs

29    Cu        63.54    8.94     0.0848    0.0309   3.85    7.2    0.326   0.611
30    Zn        65.38    7.14     0.0658    0.0304   1.10    3.6    0.072   0.237
31    Ga        69.72    5.91     0.0511    0.0283   2.80    4      0.143   0.204
32    Ge        72.60    5.36     0.0445    0.0271   2.45    3      0.109   0.134
33    As        74.91    5.73     0.0461    0.0264   4.3     6      0.198   0.277
34    Se        78.96    4.8      0.0366    0.0251   12.3    11     0.450   0.403
35    Br        79.916   3.12     0.0235    0.0247   6.7     6      0.157   0.141
36    Kr        83.80    0.0037   2.6a      0.0236   31      7.2    81a     19a
37    Rb        85.48    1.53     0.0108    0.0233   0.73    12     0.008   0.130
38    Sr        87.63    2.54     0.0175    0.0226   1.21    10     0.021   0.175
39    Y         88.92    5.51     0.0373    0.0223   1.31    3      0.049   0.112
40    Zr        91.22    6.4      0.0423    0.0218   0.185   8      0.008   0.338
41    Nb        92.91    8.4      0.0545    0.0214   1.16    5      0.063   0.273
42    Mo        95.95    10.2     0.0640    0.0207   2.70    7      0.173   0.448
43    Tc        98                          0.0203   22
44    Ru        101.1    12.2     0.0727    0.0197   2.56    6      0.186   0.436
45    Rh        102.91   12.5     0.0732    0.0193   149     5      10.9    0.366
46    Pd        106.4    12.16    0.0689    0.0187   8       3.6    0.551   0.248
47    Ag        107.88   10.5     0.0586    0.0184   63      6      3.69    0.352
48    Cd        112.41   8.65     0.0464    0.0178   2450    7      114     0.325
49    In        114.82   7.28     0.0382    0.0173   191     2.2    7.30    0.084
50    Sn        118.70   6.5      0.0330    0.0167   0.625   4      0.021   0.132
51    Sb        121.76   6.69     0.0331    0.0163   5.7     4.3    0.189   0.142
52    Te        127.61   6.24     0.0295    0.0155   4.7     5      0.139   0.148
53    I         126.91   4.93     0.0234    0.0157   7.0     3.6    0.164   0.084
54    Xe        131.30   0.0059   2.7a      0.0152   35      4.3    95a     12a
55    Cs        132.91   1.873    0.0085    0.0150   28      20     0.238   0.170
56    Ba        137.36   3.5      0.0154    0.0145   1.2     8      0.018   0.123
57    La        138.92   6.19     0.0268    0.0143   8.9     15     0.239   0.403
58    Ce        140.13   6.78     0.0292    0.0142   0.73    9      0.021   0.263
59    Pr        140.92   6.78     0.0290    0.0141   11.3    4      0.328   0.116
60    Nd        144.27   6.95     0.0290    0.0138   46      16     1.33    0.464
61    Pm        145                         0.0137   60
62    Sm        150.35   7.7      0.0309    0.0133   5600    5      173     0.155
      Sm2O3     348.70   7.43     0.0128b   0.076    11,200  22.6   143     0.289
63    Eu        152      5.22     0.0207    0.0131   4300    8      89.0    0.166
      Eu2O3     352.00   7.42     0.0127b   0.063    8600    30.2   109     0.383
Table 2.3 Cross Sections of Naturally Occurring Elements (continued)
Atomic  Element   Atomic   Density,  Nuclei per          Microscopic Cross  Macroscopic Cross
No.     or        or       g/cm3     Unit Vol.     ξ     Section, barns     Section, cm-1
        Compound  Mol. Wt.           × 10-24                σa      σs     Σa      Σs

64    Gd        157.26   7.95     0.0305    0.0127   46,000         1403
65    Tb        158.93   8.33     0.0316    0.0125   46             1.45
66    Dy        162.51   8.56     0.0317    0.0122   950     100    30.1    3.17
      Dy2O3     372.92   7.81     0.0126b   0.019    2200    214    27.7    2.7
67    Ho        164.94   8.76     0.0320    0.0121   65             2.08
68    Er        167.27   9.16     0.0330    0.0119   173     15     5.71    0.4[illegible]
69    Tm        168.94   9.35     0.0333    0.0118   127     7      4.23    0.2[illegible]
70    Yb        173.04   7.01     0.0244    0.0115   37      12     0.903   0.293
71    Lu        174.99   9.74     0.0335    0.0114   112            3.75
72    Hf        178.5    13.3     0.0449    0.0112   105     8      4.71    0.3[illegible]
73    Ta        180.95   16.6     0.0553    0.0110   21      5      1.16    0.2[illegible]
74    W         183.86   19.3     0.0632    0.0108   19.2    5      1.21    0.316
75    Re        186.22   20.53    0.0664    0.0107   86      14     5.71    0.93[illegible]
76    Os        190.2    22.48    0.0712    0.0105   15.3    11     1.09
77    Ir        192.2    22.42    0.0703    0.0104   440            30.9
78    Pt        195.09   21.37    0.0660    0.0102   8.8     10     0.581   0.6[illegible]
79    Au        197      19.32    0.0591    0.0101   98.8    9.3    5.79    0.550
80    Hg        200.61   13.55    0.0407    0.0099   380     20     15.5    0.8[illegible]
81    Ti        204.39   11.85    0.0349    0.0098   3.4     14     0.119   0.4[illegible]
82    Pb        207.21   11.35    0.0330    0.0096   0.170   11     0.006   0.3[illegible]
83    Bi        209      9.747    0.0281    0.0095   0.034   9      0.001   0.253
84    Po        210      9.24     0.0265    0.0095
85    At        211                         0.0094
86    Rn        222      0.0097   2.6a      0.0090   0.7
87    Fr        223                         0.0089
88    Ra        226.05   5        0.0133    0.0088   20             0.266
89    Ac        227                         0.0088   510
90    Th        232.05   11.3     0.0293    0.0086   7.56    12.6   0.222   0.3[illegible]
91    Pa        231      15.4     0.0402    0.0086   200            8.04
92    U         238.07   18.9     0.04783   0.0084   7.68    8.3    0.367   0.397
      UO2       270.07   10       0.0223b   0.036    7.7     16.7   0.17    0.37[illegible]
93    Np        237                         0.0084   170
94    Pu        239      19.7     0.0497    0.0083   1029    9.6    51.1    0.4[illegible]

a Value has been multiplied by 105.                    b Molecules/cm3
The microscopic cross section of boron 10 is 3838 barns and of boron 11 is .005 barns. What are the fractional abundance of these isotopes in natural boron and what is the microscopic cross section of natural boron?
Fractional abundance B10, A10 = 0.20

Fractional abundance B11, A11 = 0.80

σB = A10σ10 + A11σ11

   = (0.20)(3838) + (0.80)(0.005)

   = 768 barns

   = 768x10-24cm2
Calculate the gram atomic weight, M, of natural boron.
MB = A10M10 + A11M11

   = (0.20)(10g/m) + (0.80)(11g/m)

   = 10.8 g/m
Macroscopic cross section, Σ, is the product of number density and microscopic cross section.
Σ = Nσ 1/cm (2.11)
Σ represents the probability of neutron nucleus interaction per centimeter of neutron travel. Mean free path, mfp, is the inverse of Σ,
mfp = 1/Σ cm (2.12)
and represents the average distance a neutron travels between collisions. For strong absorbers, the mean free path is very short and neutron absorption occurs mostly on the skin or surface of the absorber. This surface absorption is called self shielding because the outer layer of atoms shield the inner layers. This phenomenon prolongs control rod lifetime by reducing the rate at which poison atoms are consumed by neutrons.
A control rod is solid natural boron which has a density of 2.45 g/cc. Determine the macroscopic cross section, Σ.
N = ρNa/M

  = (2.45 g/cc)(6.02x1023 at/m)/10.8 g/m

  = 1.37x10²³ at/cc

Σ = Nσ

  = (1.37x10²³ at/cc)(768x10-24 cm2/at)

  = 105.2 cm-1
What is the significance of macroscopic cross section?
Macroscopic cross section represents the probability of neutron interaction per cm of travel in a material.
Mean free path, mfp, is the inverse of macroscopic cross section. What is its significance?
mfp = 1/Σ cm

    = Average distance travelled by a neutron
      between interactions in a material.
A natural boron control rod blade is 0.5 in thick. Determine the mean free path of thermal neutrons (0.0254eV) in the blade.
mfp = 1/Σ

    = 1/105.2

    = 0.0095 cm

    = 0.0037 in
In most reactors, water serves as the medium to reduce fast energy fission neutrons to thermal energies by scattering interactions. This process is known as moderation. In each scattering interaction, neutrons lose energy to scattering nuclei. A term called lethargy, U, is defined to give an indication of energy loss per collision. The average change in lethargy, ξ, for collision with hydrogen is 1. For all other elements, it is approximately
ξ = 2/(A + .67) (2.13)
where A is the atomic weight of the element. As elements increase in mass, less and less energy is given up per collision so more and more collisions are required to moderate a neutron. Since a neutron must travel, on the average, one mfp between collisions, longer travel will be required to slow a neutron down and the increased likelihood of absorption by a poison or leakage out of the reactor results.
This concept applies to elastic scattering. Some heavy nuclei have larger inelastic scattering cross sections at high neutron energies than the lighter elements. As a result, they produce a greater energy decrement per collision at these energies. For reactor shielding where neutron attenuation is more important than moderation, the light elements are not necessarily the most effective shielding materials.
Lethargy, U, is defined as the natural logarithm of the ratio of initial neutron energy, E0, to final neutron energy, E, while slowing down.
U = ln(E0/E)
An average neutron decreases in energy from 2 MeV to 1eV in a reactor.
(a) Calculate the initial neutron lethargy.
U = ln (2x10⁶/2x106)

  = ln 1

  = 0
(b) Calculate the neutron lethargy for a decrease in ener[illegible] from 2 MeV to 1.0eV.
U = ln (2x10⁶/1.0)

  = ln (2x10⁶)

  = 14.5
As energy decreases, lethargy increases.
(c) What is the average change in lethargy, ξ, per collision with hydrogen?
ξ = 1
(d) How many collisions, C, on the average are required with hydrogen to reduce neutron energy from 2 MeV to 1eV?
C = U/ξ

  = 14.5/1

  = 14.5

  = 15
(e) What is the average change in lethargy per collision with graphite?
ξ = 2/(A + .67)

  = 2/(12 + .67)

  = 2/12.67

  = 0.158
(f) How many collisions on the average are required with graphite to reduce neutron energy from 2 MeV to 1 eV?
C = U/ξ

  = 14.5/0.158

  = 91.77

  = 92
(g) How many collisions on the average are required with water, heavy water, beryllium, and uranium 238 to reduce neutron energy from 2 MeV to 1 eV?
H2O                  16

D2O                  29

Be                   69

U238              1,730
Prompt fission neutrons are emitted with the continuous energy spectrum shown in Figure 2.7. The spectrum spans an energy range of approximately 10 MeV, from less than 1 to 10 MeV. The average prompt neutron energy is about 2 MeV.
Prompt neutrons are moderated to thermal energies to produce the thermal spectrum shown in Figure 2.7. The peak thermal flux, .0253 eV at room temperature of 20 C or 293 K, is approximately two decades greater than the peak fission flux, but the energy range of thermal neutrons is a small fraction of the fission energy range so that the total number of thermal neutrons in the core is less than the total number of fission neutrons.
Briefly describe the fission neutron spectrum.
Fission neutrons are born in the range 1-10 MeV with an average energy of 2 MeV.
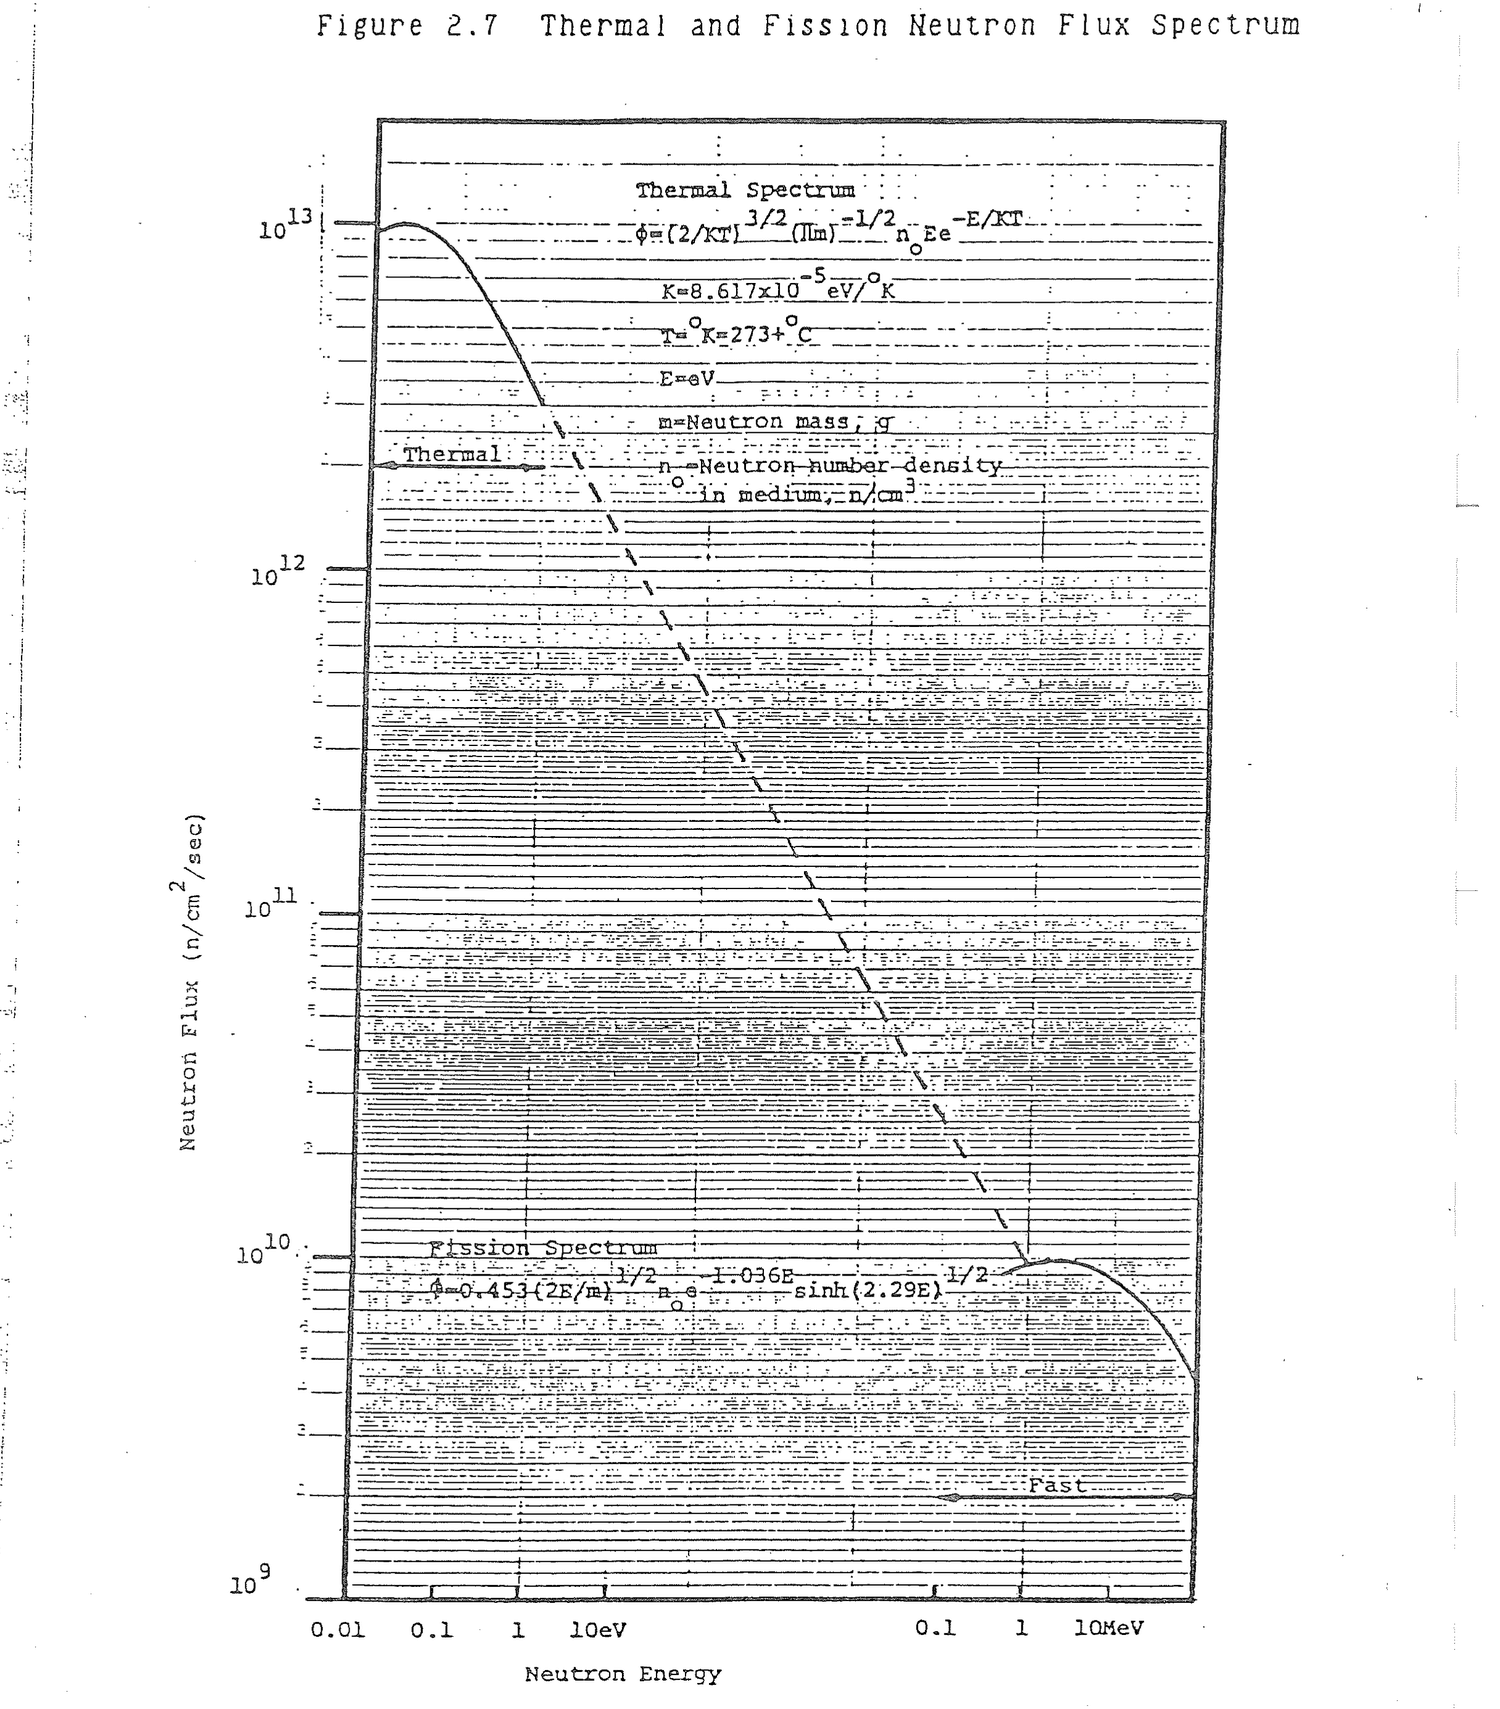
The Maxwell-Boltzmann thermal flux spectrum in a reactor is described by the equation,
φ(E) = (2/KT)3/2(πm)-1/2n0Ee-E/KT

where:

E = Neutron energy, eV.

K = 8.617x10⁻⁵eV/K

T = Temperature, K

m = Neutron mass, g

n0 = Neutron number density in the medium, n/cm3
(a) Determine the energy at which the thermal flux peaks for a reactor with room temperature coolant.
dφ(E)/dE = (2/KT)3/2(πm)-1/2n0(e-E/KT-Ee-E/KT/KT)
Set the derivative equal to zero to determine the maximum. Divide through by (2/KT)3/2(πm)-1/2n0.
0 = e-E/KT-Ee-E/KT/KT
Solve for E.
E = KT

T = 68 F = 20 C = 293 K

E = (8.617x10⁻⁵eV/K)(293K)

  = 0.0253eV
(b) Calculate the speed of room temperature neutrons.
E = mv2/2

v = (2E/m)1/2

  = ((2)(.0253eV)(1.60x10⁻¹²erg/eV)/1.67x10-24g)1/2

  = (4.85x1010 cm2/sec2)1/2

  = 220,180 cm/sec

  = 2202 m/sec
(c) Determine the energy at which the thermal flux peaks for a reactor operating at a moderator temperature of 570F.
T = 570F = 299C = 572K

E = KT

  = (8.617x10⁻⁵eV/K)(572K)

  = 0.0493eV
(d) Calculate the speed of neutrons in a 570F moderator.
v = (2E/m)1/2

  = ((2)(.0493eV)(1.60x10⁻¹²erg/eV)/1.67x10-24g)1/2

  = (9.45x10¹⁰)1/2

  = 307,355 cm/sec

  = 3,074 m/sec
The most fundamental reaction in a nuclear reactor is the interaction of neutron flux wih nuclei. This reaction, mathematically represented as the product of the macroscopic cross section and flux, is called the reaction rate.
R = Σφ    neutron-nuclei/cm3sec                                (2.14)

  = Nσφ
The fission process is a reaction rate between thermal flux and fuel nuclei
R = Σfφ    fissions/cm3sec                                    (2.15)

  = N235σfφ
Reactor power is the reaction rate for fission times the volume of the core, V.
P = ΣfφV fissions/sec (2.16)
Reaction rate, in addition to producing power in the reactor, accounts for absorption of neutrons by control rods, burnout of xenon, and activation of core materials.
A typical reactor core at the beginning of life contains 100,000 kg uranium with an average 2% enrichment. If the average core thermal flux is 4x10¹³ n/cm2/sec, determine the fission reaction rate and the reactor power.
g 235/core = (100,000 kgU/core)(2 kg235/100 kg U)
             (1,000 g/kg)

           = 2x10⁶ g235/core

N235V = (g235/core)Na/M

      = (2x10⁶ g235/core)(6.02x1023 at/m)/(235 g/m)

      = 5.13x1027 at 235/core

    P = RV

      = N235σfφV

      = N235Vσfφ

      = (5.13x1027 at235/core)(577x10-24 cm2)
        (4x10¹³ n/cm2/sec)

      = 1.18x10²⁰ fiss/sec

      = (1.18x10²⁰ fis/sec)(200 MeV/fiss)
        (106 eV/MeV)(1.6x10-19w-sec/eV)(Mw/106 w)

      = 3,776 Mw
The number density of xenon-135 in a reactor core is 1x10¹⁶ at/cm3. Average core flux is 2x10¹³ n/cm2/sec. Determine the xenon-135 absorption reaction rate.
R = N135σaφ

  = (1x10¹⁶ at/cm3)(2.7x10-18 cm2)(2x10¹³ n/cm2/sec)

  = 5.4x10¹¹ absorptions/sec/cm3
Core material atoms are converted to radioactive isotopes during reactor operation by neutron absorption or neutron activation. At the same time, the isotopes produced decay with a radioactive half-life. An equilibrium is reached for each isotope between formation by activation and loss by decay. Mathematically, this is expressed as
dNa/dt = Ntσtφ-λaNa (2.17)
Note that this equation looks similar to the equation for radioactive decay, equation (2.5), except for the additional term. Because of that term, the solution is somewhat different.
Na(t) = (Ntσtφ/λa)(1-e-λat) (2.18)
A plot of this expression shows that the starting value is zero and the number of atoms builds up with time to a final value of Ntσtφ/λa which is called the saturated activity.
Neutron activation buildup is the mirror image of radioactive decay as can be seen in Figure 2.8. After one half-life of decay, half of the original activity remains. After one half-life of activation, the activated atoms have built up to half of their final, steady state number.
                       Radioactive Decay          Neutron Activation
Number of              (Fraction of Initial       (Fraction of Steady
Half-Lives             Activity, e-693t/T2)     State, 1-e-.693t/T2)

    1                      0.5 A0                   0.5Ntσtφ/λa

    2                      0.25                     0.75

    3                      0.125                    0.875

    4                      0.0625                   0.9375

    5                      0.03125                  0.96875

    6                      0.01563                  0.98437

    7                      0.00781 (<1%)            0.99219 (>99%)

    8                      0.00391                  0.99609

    9                      0.00195                  0.99805

   10                      0.00098 (<.1%)           0.99902 (>99.9%)
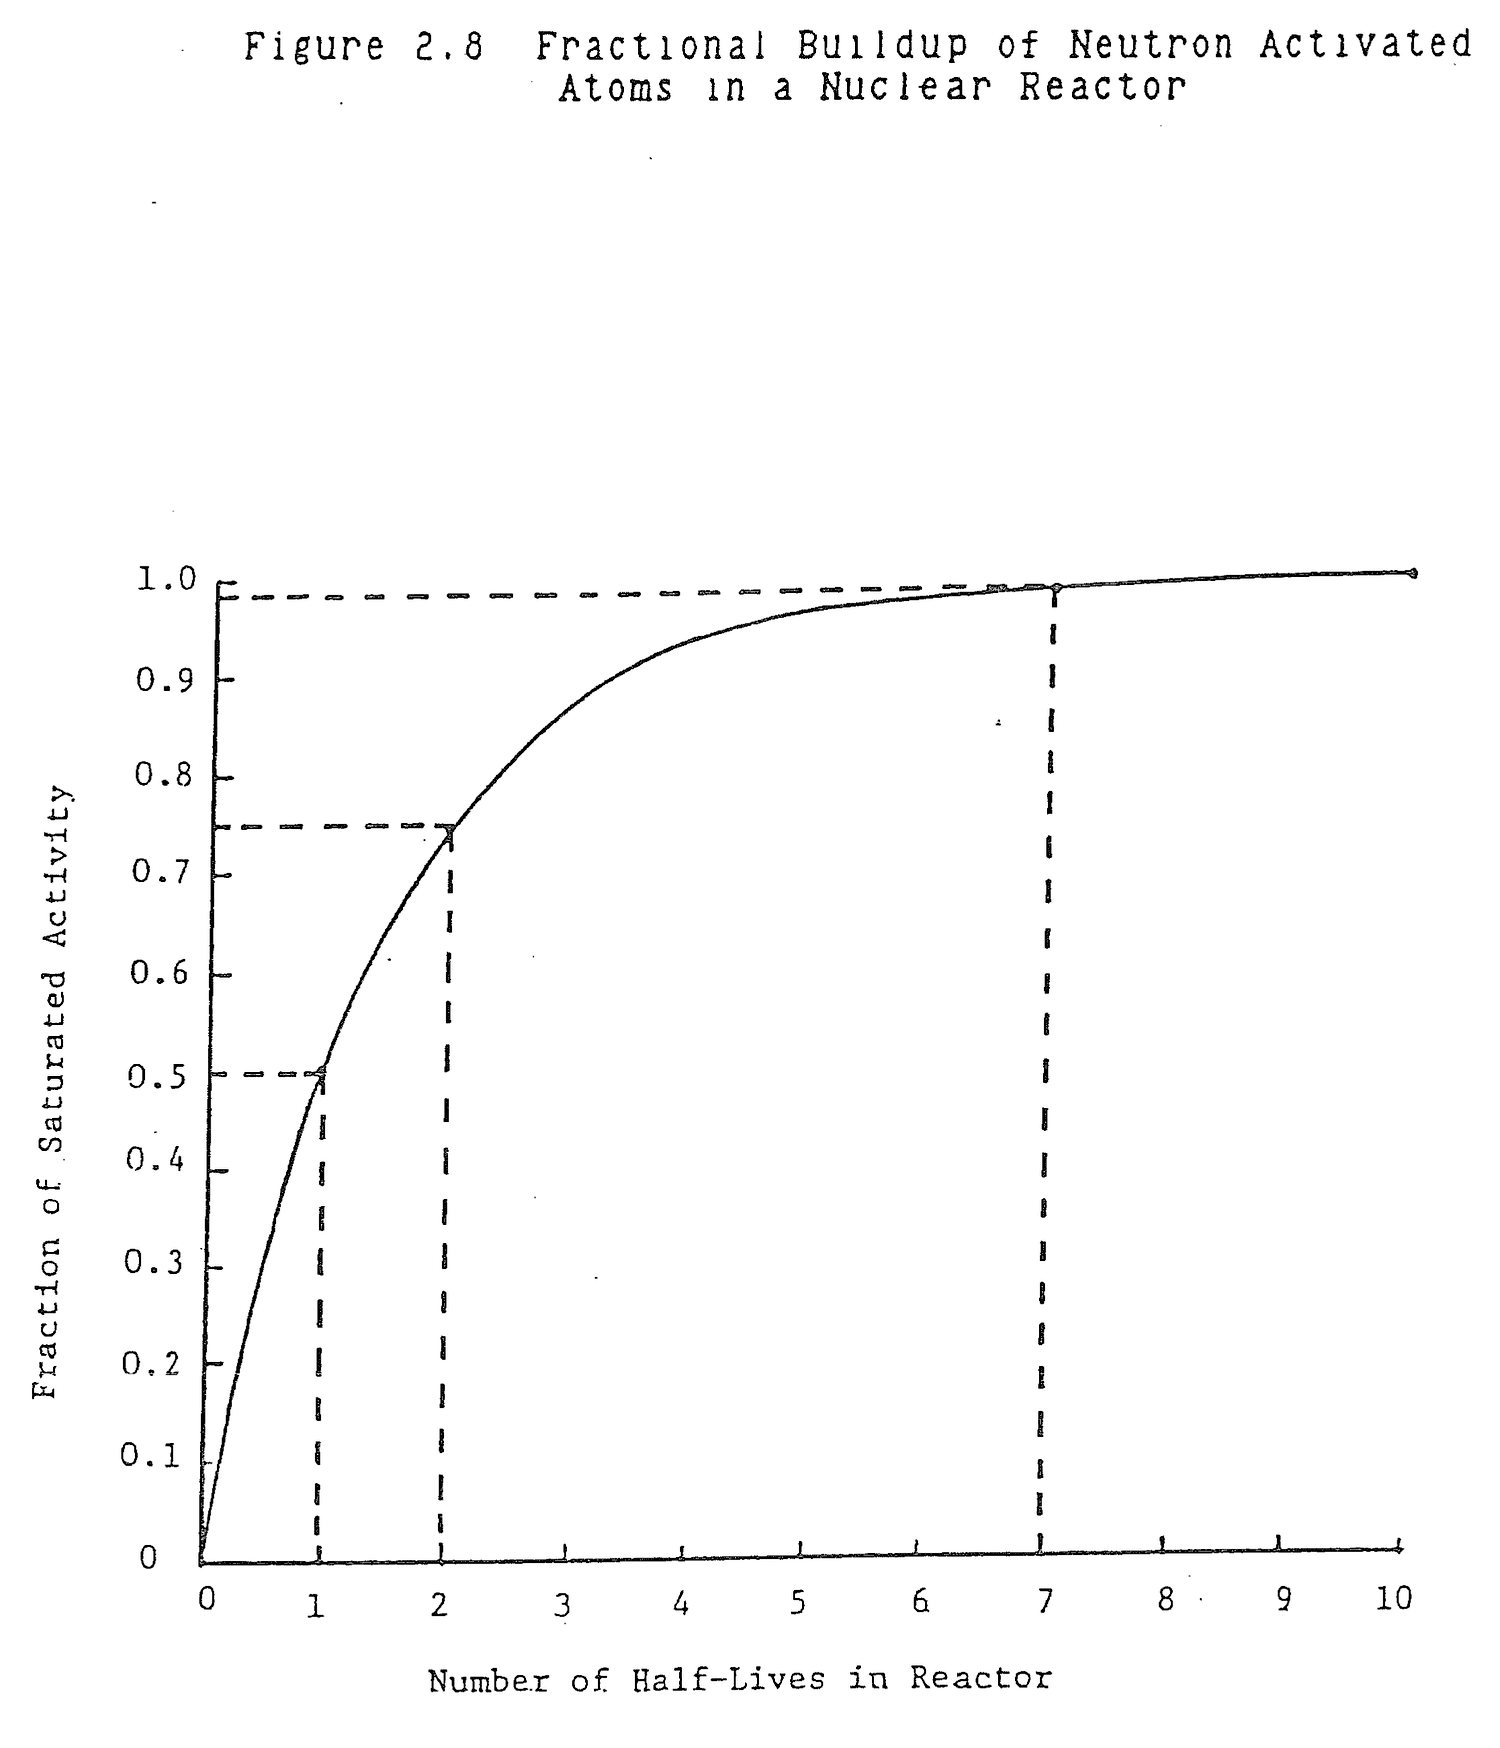
Describe neutron activation.
When a material is placed in a reactor core's neutron flux, target atoms in the material absorb neutrons and become activated atoms. At the same time, the activated atoms decay. A balance is reached in the material when the rate of activation equals the rate of decay that determines the equilibrium or steady state activity in the material.
Describe the general time response characteristics of neutron activation.
Neutron activation is the mirror image of radioactive decay; activity builds up exponentially starting from zero to the equilibrium or stedy state level of activity. After one half-life, T2, activity builds up to half the saturated level. After 2T2, activity is 3/4 of steady state. After 3T2, it is 7/8 of equilibrium. After about 7T2, activity has increased to over 99% of the steady state level and can be considered as having reached equilibrium.
A one inch cube of iron is inserted into a reactor core in an average thermal flux of 1x10¹³n/cm2/sec. Calculate the maximum amount of Fe59 activity, A59, that can develop in the cube.
V = (1 in3)(2.543cc/in3)

  = 16.39cc

ρ = 7.86 g/cc (Table 2.3)

WFe = pV

    = (7.86 g/cc)(16.39cc/cube)

    = 128.83 g/cube

NFe = WFe Na/M
  = (128.83 g Fe)(6.02x10²³ atom/m)/
    (55.847 g/m)

  = 1.39x1024 atom Fe in cube
Fe59 is formed by neutron activation of Fe58. The fractional abundance of Fe58 in natural iron is 0.003.
N58 = 0.003 NFe

    = (0.003)(1.39x1024 atom Fe)

    = 4.17x10²¹ atom Fe58
Fe59 half-life, T2, is 44.6 days = 3.85x10⁶ sec.
λ59 = 0.693/T2

    = 0.693/3.85x106 sec

    = 1.80x10⁻⁷ sec-1
The activation equation is
dN59/dt = N58σ58φ-λ59N59

        = 0  to determine steady state
Solve for N59
N59 = N58σ58φ/λ59

    = (4.17x10²¹ atom Fe58)(1.2x10⁻²⁴ cm2)
      (1x10¹³ n/cm2sec)/(1.8x10-7 sec-1)

    = 2.78x10¹⁷ atom Fe59

A59 = λ59 N59

    = (1.80x10⁻⁷ sec-1)(2.78x10¹⁷ atom Fe59)

    = 5.01x10¹⁰ dps

    = (5.01x10¹⁰ dps)(Ci/3.7x1010 dps)

    = 1.35 Ci
One curie each of Cu64 and Cu67 are placed at opposite ends of a balance scale. Will the scale be in balance?
λ64 = .693/T64

    = .693/12.71 hr

    = .055 hr-1

λ67 = .693/T67

    = .693/61.7 hr

    = .011 hr-1

A64 = λ64N64 = λ67N67 = A67 = 1 Ci

N67 = λ64N64/λ67

    = .055 N64/.011

    = 5N64
There are five times as many Cu 67 atoms as there are Cu 64 atoms. The scale will tip in the Cu 67 direction.
How many half lives are required for a radioactive isotope to decay away?
Assume that an isotope has decayed away when it reaches less than 1% of its original activity.
A = A0e-.693t/T2

  = 0.01A0

0.01 = e-.693t/T2

-4.61 = -.693t/T2

t = 6.65T2

t ≈ 7T2
How long does it take for an activated isotope to reach equilibrium or steady state level?
Since activation is the mirror image of decay, after 7T2 the activated isotope will be greater than 99% of its steady state level.
Table 2.3 provides the densities, number densities, lethargies, microscopic cross sections, and macroscopic cross sections for the elements and some materials used in nuclear reactors. Table 2.4 lists properties of moderators. Cross sections for isotopes of special interest are shown in Table 2.5.
Table 2.4  Properties of Moderators at 78F (20C)

                                                     Heavy Water                    Beryllium      Graphite       Diphenyl      Zir[illegible]
Material                             Ordinary        (99.75% D2O)    Beryllium     Oxide          (Reactor       (at 200°F)    Hy[illegible]
                                     Water                                                         grade)                       (ZrH[illegible]
---------------------------------------------------------------------------------------------------------------------------------------------

Atomic (or molecular)
  weight......................        18              20              9            25             12             154            93.2
Density (g/cm3)...............         1.00            1.10            1.84          3.0            1.70           0.96          5.6[illegible]
N (atoms or molecules
  per cm3) × 10-24............         0.0334          0.0332          0.124         0.072          0.0855         0.0039        0[illegible]
Thermal (2200 m/sec)
  σa (barns)..................        0.66            0.003           0.010         0.010          0.0037         2.5           0.8[illegible]
  σs (barns)..................      103              13.6            7.0           6.8            4.8          600             [illegible]
  Σa (cm-1)...................        0.022           8.5 × 10⁻⁵      0.00123       0.00073        0.00032        0.01          0[illegible]
  Σs (cm-1)...................        3.45            0.45            0.86          0.50           0.41           2.3           —
  D (cm).......................        0.17            0.85            0.54          0.66           0.94           0.24          ~0.2
  L (cm).......................        2.76          100              21            30             54.2           4.9           [illegible]
Epithermal
  ξ............................        0.93            0.51            0.206         0.17           0.158          0.81          0.5[illegible]
  σs (barns)..................       42              10.5            6.1           9.9            4.8          260             48.[illegible]
  Σs (cm-1)...................        1.40            0.35            0.75          0.72           0.41           1.0           1[illegible]
  ξΣs (cm-1)..................        1.28            0.18            0.16          0.12           0.065          0.8           1[illegible]
  ξΣs/Σa.......................       58              21,000        130           163            200             80            49
Age to thermal
  τ (cm2).......................       31             120              85           100            350             58            27
Table 2.5  Thermal Neutron Cross Sections
           Of Special Interest

Isotope              Cross Section (barns)          Reaction
-------              ---------------------          --------

Lithium 6                    945                     (n,α)
Lithium 7                   .033                     (n,γ)

Boron 10                   3,838                     (n,α)
Boron 11                     .05                     (n,γ)

Silver 107                    40                     (n,γ)
                           3,000 at 5eV             Resonance

Cadmium 113               19,900                     (n,γ)

Indium 113                   320                     (n,γ)

Xenon 135                 2.7 x 10⁶                   (n,γ)

Samarium 149              41,000                     (n,γ)

Gadolinium 155            61,000                     (n,γ)
Gadolinium 157           255,000                     (n,γ)

Hafnium 177                  380                     (n,γ)
                           6,000 at 2.36eV          Resonance
Hafnium 178                   75                     (n,γ)
                          10,000 at 7.8eV           Resonance
Hafnium 179                   65                     (n,γ)
                           1,100 at 5.69eV          Resonance
Hafnium 180                   14                     (n,γ)
                             130 at 74eV            Resonance

Uranium 233                   54                     (n,γ)
                             527                    Fission
Uranium 235                  106                     (n,γ)
                             577                    Fission
Uranium 238                 2.71                     (n,γ)
                          10,000 at 40eV            Resonance

Plutonium 239                287                     (n,γ)
                             742                    Fission
Plutonium 240                300                     (n,γ)
                         100,000 at 1eV             Resonance
Plutonium 241                375                     (n,γ)
                           1,025                    Fission
2.8.1 (a) Explain the meaning of nuclear cross section.
(b) What are the units of cross section?
(c) What does the product of flux and cross section give?
Solution:
(a) Microscopic: Effective cross sectional area of a single nucleus presented to an oncoming neutron, σ(cm2).
Macroscopic: Probability of interaction of a neutron per unit path length of travel, Σ = Nσ (1/cm = 1/cm3xcm2)
(b) σ: barns = 10-24cm2
Σ: 1/cm
(c) Reaction rate, R = Σφ (interactions/cm3sec)
2.8.2 Complete the following equations:
(a)  92U238  -->  2He4 + ?Th?

(b)  84Po210  -->  2He4 + ?Pb?

(c)  82Pb210  -->  -1β0 + ?Bi?

(d)  29Cu65 + 0n1 --> 29Cu66* --> -1β0 + ?Zn?

(e)  2He4 + 4Be9 -->  0n1 + ?C?
Solution:
(a)  90Th234

(b)  82Pb206

(c)  83Bi210

(d)  30Zn66

(e)  6C12
2.8.3 Many neutron reactions occur in an operating reactor. Indicate, using a simple formula, or explain in your own words, the following reactions:
(a) Fission;
(b) Pu -239 production;
(c) Photo-neutron production;
(d) Isotope production in the control rods.
Solution:                                         --> FP1

(a)  0n1TH + 92U235 --> 92U236        --> FP2

                                                  -->2.40n1F

(b)  0n1F + 92U238 --> 92U239 -->

          -1β0 + 93NP239 --> -1β0 + 94Pu239

(c)  0/2g/10 + 1H2 --> 1H1 + 0n1

(d)  0n1TH + 26Fe58 --> 26Fe59
2.8.4 If the density of cobalt is 8.9 gm/cm3, how many atoms are there in one cubic centimeter?
Solution:
N atom/cm3 = ρ gm/cm3(Na atom/mole/GMW gm/mole)

           = 8.9 (6.02x10²³/58.95)

           = 9.1x10²²
2.8.5 Define fuel enrichment.
Solution:
Fuel enrichment expresses the weight percent of U-235 present in uranium.
2.8.6 (a) How is plutonium formed in the reactor core?
(b) How does it affect core reactivity?
Solution:
                                        -1β0
(a)  92U238 + 0n1 --> 92U239 -->

                 -1β0
     93Np239 --> 94Pu239
(b) As Pu-239 builds in, it increases reactivity since it is fissile.
2.8.7 Why is H2O a good moderator?
Solution:
H2O has a relatively low absorption and good scattering cross section and can thermalize neutrons in as few as one collision.
2.8.8 The formula for moderating ratio (MR) is:
MR = ξ σs/σa
ξ is a measure of the average change in neutron energy per collision.
Compare H2O, D2O, beryllium and graphite as moderators by discussing the ratio of σs/σa.
                      σs                    σa
                  ---------             ---------

H2O                  103                   .66

D2O                   13.6                 .001

Be                     7                   .01

C                      4.8                 .004
Solution:
                 σs            σa              σs/σa
              --------       --------        -----------

H2O            103            .66              156

D2O             13.6          .001          13,600

Be               7            .01              700

C                4.8          .004           1,200
Purely as a moderator, water is the least desirable of the four materials because of its high absorption cross section. Water has the advantage, because of its high σs, that neutron diffusion length is relatively small so moderation and absorption in fuel can occur readily within the small volume of the core. If the others were used as moderators, the core would have to be enlarged to have a critical mass.
D2O is excellent as a reflector because a reflector provides a large path length for moderation and σa is so small that few thermal neutrons are lost to absorption.
2.8.9 (a) Compare the function of a moderator to that of a reflector in a reactor.
(b) Compare the influence which the value of the atomic weight of a particular material has on how good a moderator it is with its influence or how good a reflector the materials is. Explain.
(c) What other nuclear properties are relevant to whether a particular material constitutes a good moderator or reflector. Explain.
Solution:
(a) Moderator: Reduce fast neutrons to thermal range within the core volume.
Reflector: Scatter leakage neutrons back into the core with a minimum loss to absorption.
(b) Both must have good scattering properties, so low atomic weight materials are best, in a thermal reactor, for moderators and reflectors. In a fast reactor, the reflector would be of high atomic weight to minimize moderation. In a hydrogen collision, a neutron can loose all of its energy down to thermal range in one collision so hydrogen is optimum.
(c) A minimum absorption cross section is desired. In a moderator, which must accomplish its purpose in a very short distance, a relatively large σa is acceptable if σs is large, as is the case with water. In a reflector, where distance may not be critical, σa should be as small as possible. Moderating ratio, proportional to σs/σa, should be as large as possible, as in D2O, beryllium, and graphite.
2.8.10 It is predicted that the average neutron flux in your reactor will be higher with a graphite reflected core than with a water reflected core. Why is this true?
Solution:
Graphite is a better reflector than water, because it has a lower absorption cross section. However, it isn't quite as good a moderator, as the average energy loss per collision is less. Overall, the flux would be higher because fewer neutrons would escape the core.
2.8.11 How many days would a reactor at a power level of 2000 kw have to be operated at to produce 60 Mwd of energy?
Solution:
2000 kw = 2 Mw

60 Mwd/2Mw = 30 days
2.8.12 (a) How is the energy released in fission distributed?
(b) Indicate which mechanisms ultimately release their energy as heat.
(c) Which mechanisms result in immediate release and which can be considered to release energy after the fission process ceases?
Solution:
(a) 93%(185 MeV): Prompt neutron, beta, fission product kinetic energy and fission gammas.
7% (15 MeV): Fission product decay gammas and betas.
(b) All of the above.
(c) Immediate: Prompt neutron, beta, fission product kinetic energy and fission gammas.
2.8.13 Explain why the neutron flux is used as a measure of reactor power.
Solution:
Reactor power, that is, the heat generated in the core, is linearly proportional to the fission rate in the core. Ninety three percent of the heat is
produced by direct fission product, neutron, beta and gamma kinetic energy dissipation. Seven percent comes from fission product decay gammas and betas.
Reaction Rate, R = N235σf235φ fissions/cm3.sec

Power, P = R x Volume x 200MeV/fission

         = 200 x Volume x N235σf235φ
2.8.14 An experimenter wishes to irradiate a sample for 20 minutes to obtain an activity of 21 mCi.
(a) What factors would need to be known to determine how much material would need to be irradiated?
(b) If the irradiation time were doubled, would you expect the activity to double? Explain your answer.
Solution:
(a) One would have to know:
1. Atomic weight, element and isotope.
2. Avogadro's number.
3. Half-life.
4. Mass.
5. Neutron flux.
6. Neutron activation cross section.
7. Isotope abundance.
(b) No, radioactive build up is a log function. In one half life, 50% of saturated activity is produced. As the exposure is continued, the activity builds up more and more slowly. With each T2, it increases half the the remaining value between the present fraction of equilibrium and the final, steady state activity; the mirror of decay.
2.8.15 Explain the source of nitrogen 16 in reactor coolant.
2.8.16 An iron and uranium alloy is 50 weight percent iron and 50 weight percent uranium.
(a) Calculate the atom fractions of iron and uranium in alloy.
(b) Calculate the volume fractions of iron and uranium.
(c) Based on the values in (a) and (b), what conclusions can be drawn concerning the relative sizes (volumes) of iron and uranium atoms.
2.8.17 The flow rate through a BWR core is 100x106 lbm/hr. Main steam flow rate leaving the reactor vessel is 14x106 lbm/hr at 1,000 psia.
(a) Calculate the weight fractions (quality) of steam and water at the core exit.
(b) Calculate the volume fractions (void fraction) of steam and water at the core exit. The specific volume of water at 1,000 psia is 0.0216 ft3/lbm and the specific volume of steam is 0.4460 ft3/lbm.
Absorption of a thermal neutron in fissile material and absorption of a high energy neutron in fissionable material cause fission. Fission produces high energy fission fragments, beta particles, and gamma rays that are predominantly absorbed in the fuel and generate potentially useful heat. With sufficient fuel in a core, the fission reaction is self sustaining because more than two neutrons are produced for each neutron absorbed by fuel.
After studying the lesson material and working exercise problems, the student should be able to:
1. Describe the fission process, fission product characteristics, and energy release in fission.
2. Define delayed neutron fraction, effective delayed neutron fraction, and sources of delayed neutrons.
3. Describe and calculate the delayed neutron fraction in a mixed core.
4. Describe the chain reaction, a neutron generation, the core multiplication factor, and primary operating factors that affect neutron multiplication and their effects.
5. Define the six factors of Keff and typical values, the multiplication factor for an infinite reactor, criticality, subcriticality, supercriticality, reactivity, neutron lifetime with representative values, prompt generation time with representative values, and delayed generation time with representative values.
6. Calculate Keff given six factor values or neutron population data and calculate reactor power based on Keff and generation time.
7. Describe the effect of delayed neutrons on reactor control.
When a fissile nucleus absorbs a neutron, the compound nucleus that is formed can decay in several ways. At low neutron energies, inelastic scattering does not occur and the elastic scattering cross section is small. Fission and radiative capture are the principal modes of decay of the compound nucleus. The relative probability of these processes is not constant. It depends upon the incident neutron energy and the fissile nucleus.
The principal fissile nuclei are listed in Table 3.1. In addition, the microscopic fission cross section, σf, microscopic radiative capture cross section, σc, and average number of prompt neutrons released per fission, ν, are shown for each nucleus. The cross section values for U233, U235, Pu239, and Pu 241 are thermal cross sections; Th232 and U238 are 10MeV values because these isotopes primarily undergo fast fission.
Define fissile, fissionable, and fertile nuclei.
Fissile nuclei fission following the absorption of a zero energy neutron. The principal fissile nuclei are U233, U235, Pu239, and Pu241.
Fissionable nuclei must absorb a neutron with sufficient kinetic energy in order to fission. U238 is the principal fissionable nucleus.
Fertile isotopes are not fissile, but fissile isotopes can be produced from them. U238 and Th232 are the main fertile isotopes in reactor applications from which are produced Pu239 and U233.
What fraction of thermal neutrons absorbed in U235 and Pu239 produce fission?
U235 Fission Capture = σf/(σf+σc)

                     = 577/(577 + 106)

                     = 0.84

Pu239 Fission Capture = 742/(742 + 287)

                      = 0.72
Table 3.1  Fissile Nuclide Data

Isotope         σf          σc          ν         Energy
              (barns)     (barns)

90Th232          0.3         0.01       1.87      10MeV

92U233         527          54         2.50      .0253eV

92U235         577         106         2.42      .0253eV

92U238           1.0         0.002      2.30      10MeV

94Pu239        742         287         2.87      .0253eV

94Pu241       1025         375         2.93      .0253eV
A fissioning nucleus releases the majority of its energy as kinetic energy of the fission products. The remainder, as shown in Table 3.2, is emitted as beta particles, gamma rays, neutrinos, and neutrons of various energies. Gamma rays result directly from fission and from the radioactive decay of fission products. Beta particles result from fission product decay.
Figure 3.1 is a series of plots of fission product yield fractions versus fission product mass number for thermal fission of uranium-233 and plutonium-239, thermal and fast fission of uranium-235, and fast fission of thorium-232 and uranium-238. In every case, the dominant fission product mass numbers are in the 95 and 140 range. For uranium-235 fission such problem isotopes, with their fractional yields shown in parentheses, as krypton-85 (.0029) and strontium-90 (.058) are formed in the lower range. In the higher range, iodine-131 (.031), iodine-133 (.069), iodine-135 (.061), xenon-133 (.066), xenon-135 (.003) and promethium-149 (.011) are yielded.
How much energy is released per U235 fission?
200 MeV
Of the 200 MeV per fission, what fraction is produced from fission product beta and gamma decay? What is the significance of this energy?
Decay Heat = (Fission Product β and gamma)/200 MeV

           = (8 + 7)/200

           = 0.075
Following reactor shutdown, this decay heat must be removed by cooling systems. Decay heat decays away much more slowly than the core neutron population.
Table 3.2  Emitted and Recoverable
    Energies for Fission of
         Uranium-235

                            Emitted Energy        Recoverable Energy
          Form                  (MeV)                    (MeV)
------------------------    --------------        ------------------
Fission fragments                168                      168
Fission product decay
    β-rays                         8                        8
    gamma rays                     7                        7
    neutrinos                     12                        0
Prompt gamma rays                  7                        7
Fission neutrons
   (kinetic energy)                5                        5
Capture gamma rays                 0                      3-12
                                   -                      ----
        TOTAL                    207                    198-207
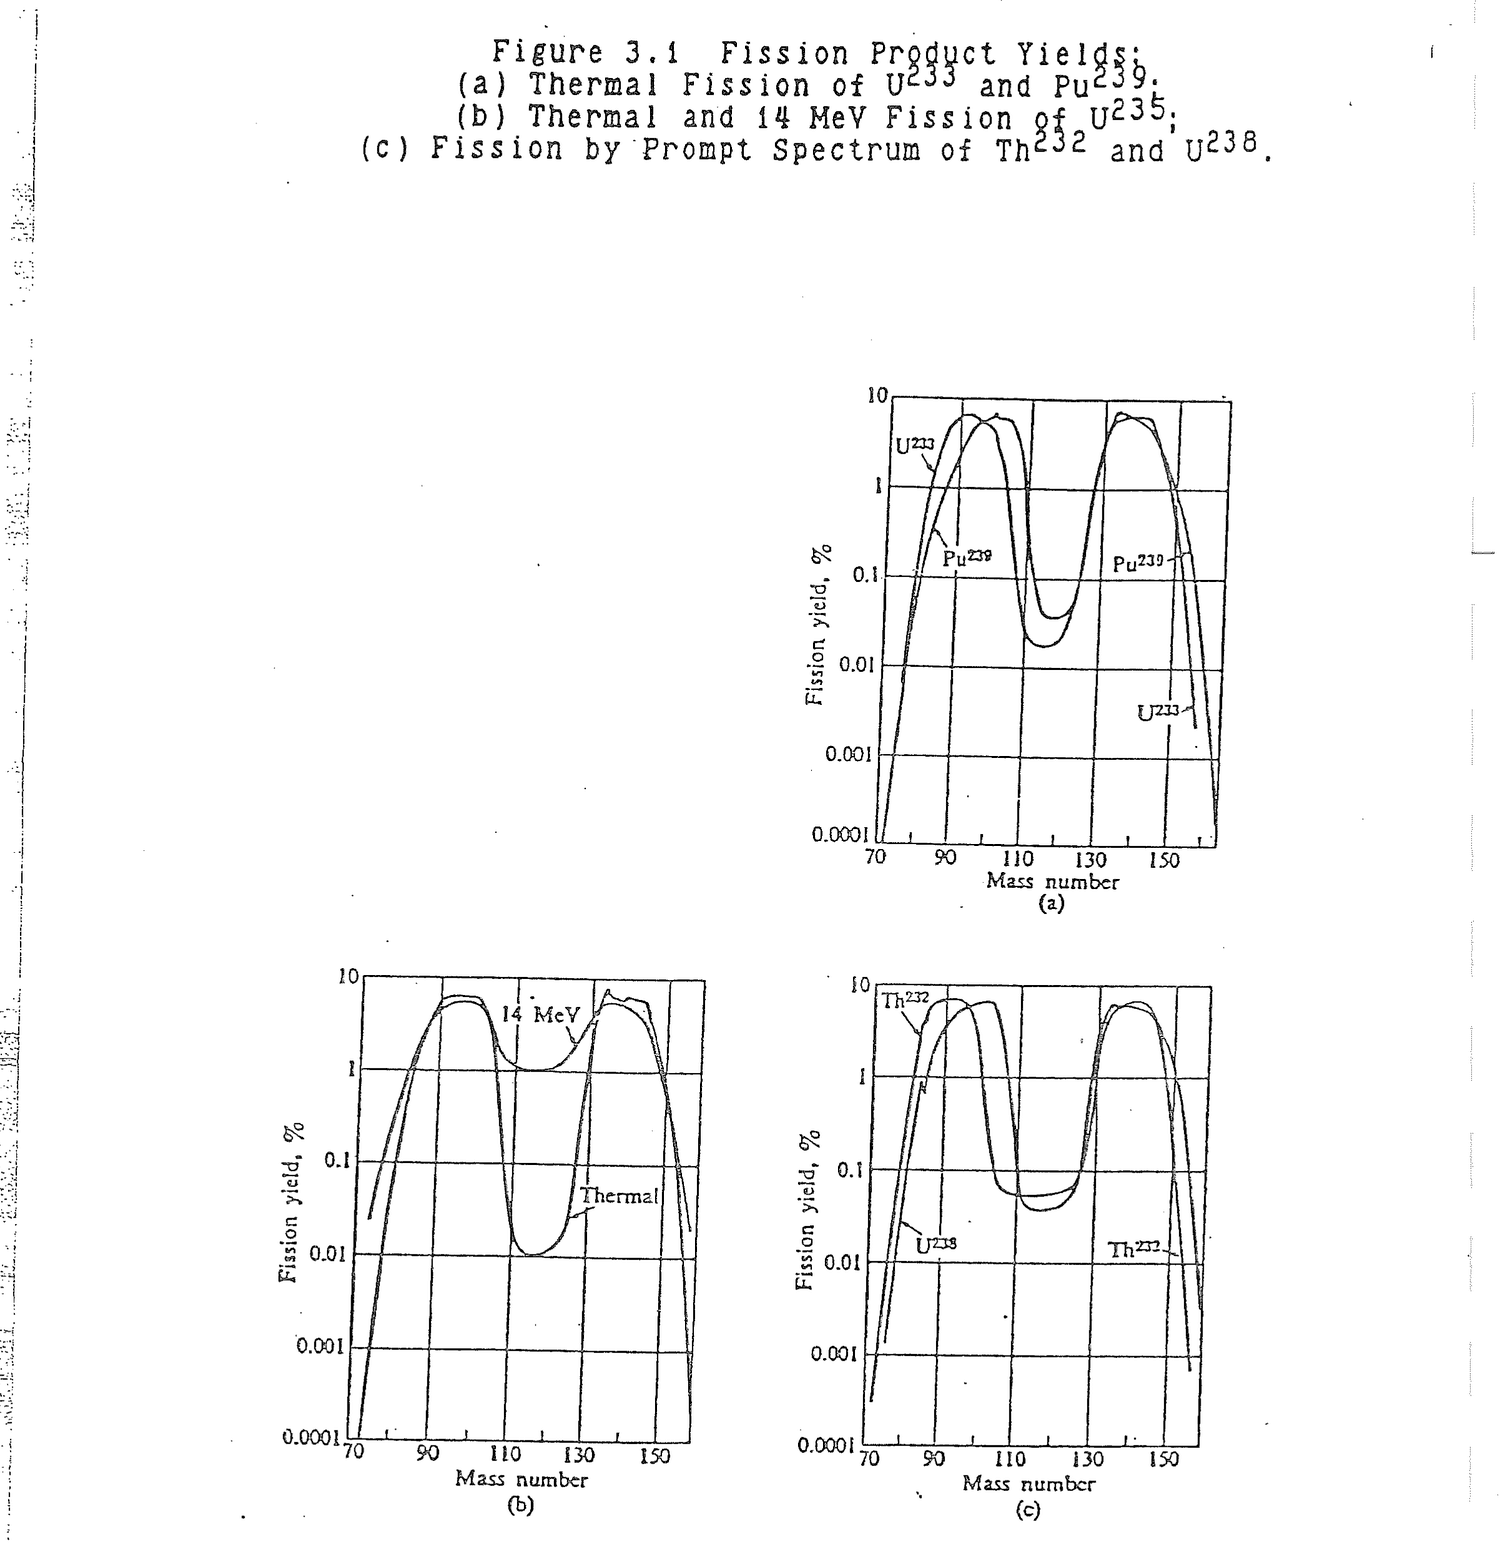
What are the approximate mass numbers of the dominant fission products?
95 and 140
List some of the problem fission products.
Krypton-85          Gas
Strontium-90        Pure beta emitter
Iodine-131, 133     Volatile, low body burden
Iodine-135          Source of Xe135
Xenon-133           Gas
Xenon-135           Gas, high absorption cross
                        section
Promethium-149      Source of Sm149
Some fission products, called precursors, produce neutrons indirectly by radioactive decay. These neutrons are called delayed neutrons because they are not produced promptly at the instant of fission. The number of delayed neutrons produced by fission product decay, as a fraction of the total prompt and delayed neutrons in the core, is referred to as the delayed neutron fraction, β.
A list of delayed neutron precursors is provided in Table 3.3. The precursor isotopes are divided into six groups based upon half-life. A degree of uncertainty exists concerning the exact identity of some of the short lived precursors. Table 3.4 provides the total delayed neutron fraction and the delayed neutron fraction of each precursor group for uranium-233, uranium-235, and plutonium-239. The delayed neutron fraction for uranium-235, as an example, is 0.0065 which means that of all the neutrons in the core, less than one percent are delayed.
From Table 3.3, the precursor with the longest half-life is bromine-87; the half life is 55.7 seconds. Bromine-87 is significant because when the reactor is shutdown and prompt and shorter lived delayed neutrons have decayed away, the core neutron population is maintained by delayed neutrons produced by the decay of bromine-87. The decay scheme for bromine-87 is shown in Figure 3.2. Approximately 30 percent of bromine-87 nuclei decay by beta emission to krypton-87 at ground state energy while 70 percent decay by beta emission to an excited state of krypton-87. Of the later 70 percent, about two percent of the excited krypton-87s
Table 3.3  Delayed Neutron Precurors

Delayed Neutron           Delayed Neutron         Delayed Neutron
Precursor Group             Precursor             Precursor Half-Life
---------------           ---------------         -------------------

      1                   Bromine-87              55.7 seconds

      2                   Iodine-137              24.5 seconds
                          Bromine-88              16.3 seconds

      3                   Iodine-138               6.5 seconds
                          Bromine-89               4.4 seconds
                          Rubidium-93              5.9 seconds

      4                   Iodine-139               2.4 seconds
                          Cesium-144               1.0 seconds
                          Tellurium-137            3.5 seconds
                          Bromine-90               1.8 seconds
                          Krypton-92               1.8 seconds
                          Krypton-93               1.3 seconds

      5                   Krypton-95               0.8 seconds
                          Iodine-140               0.9 seconds
                          Iodine-141               0.5 seconds

      6                   Iodine-142               0.2 seconds
                          Bromine-92               0.4 seconds
                          Rubidium-95              0.4 seconds
                          Rubidium-97              0.2 seconds
Table 3.4  Delayed Neutron Data for Thermal Fission in
     Uranium-233, Uranium-235, and Plutonium-239.

-------------------------------------------------------------------------------
                                    U233
-------------------------------------------------------------------------------
          |  Half-life  |  Decay constant   |  Yield (neutrons  |   Fraction
  Group   |    (sec)    |  λi (sec-1)    |   per fission)    |     βi
-------------------------------------------------------------------------------
    1     |    55.00    |     0.0126        |     0.00057       |   0.000224
    2     |    20.57    |     0.0337        |     0.00197       |   0.000777
    3     |     5.00    |     0.139         |     0.00166       |   0.000655
    4     |     2.13    |     0.325         |     0.00184       |   0.000723
    5     |     0.615   |     1.13          |     0.00034       |   0.000133
    6     |     0.277   |     2.50          |     0.00022       |   0.000088
-------------------------------------------------------------------------------
                              Total yield: 0.0066
                              Total delayed fraction (β):     0.0026
-------------------------------------------------------------------------------
                                    U235
-------------------------------------------------------------------------------
          |  Half-life  |  Decay constant   |  Yield (neutrons  |   Fraction
  Group   |    (sec)    |  λi (sec-1)    |   per fission)    |     βi
-------------------------------------------------------------------------------
    1     |    55.72    |     0.0124        |     0.00052       |   0.000215
    2     |    22.72    |     0.0305        |     0.00346       |   0.001424
    3     |     6.22    |     0.111         |     0.00310       |   0.001274
    4     |     2.30    |     0.301         |     0.00624       |   0.002568
    5     |     0.610   |     1.14          |     0.00182       |   0.000748
    6     |     0.230   |     3.01          |     0.00066       |   0.000273
-------------------------------------------------------------------------------
                              Total yield: 0.0158
                              Total delayed fraction (β):     0.0065
-------------------------------------------------------------------------------
                                    Pu239
-------------------------------------------------------------------------------
          |  Half-life  |  Decay constant   |  Yield (neutrons  |   Fraction
  Group   |    (sec)    |  λi (sec-1)    |   per fission)    |     βi
-------------------------------------------------------------------------------
    1     |    54.28    |     0.0128        |     0.00021       |   0.000073
    2     |    23.04    |     0.0301        |     0.00182       |   0.000626
    3     |     5.60    |     0.124         |     0.00129       |   0.000443
    4     |     2.13    |     0.325         |     0.00199       |   0.000685
    5     |     0.618   |     1.12          |     0.00052       |   0.000181
    6     |     0.257   |     2.69          |     0.00027       |   0.000092
-------------------------------------------------------------------------------
                              Total yield: 0.0061
                              Total delayed fraction (β):     0.0021
-------------------------------------------------------------------------------
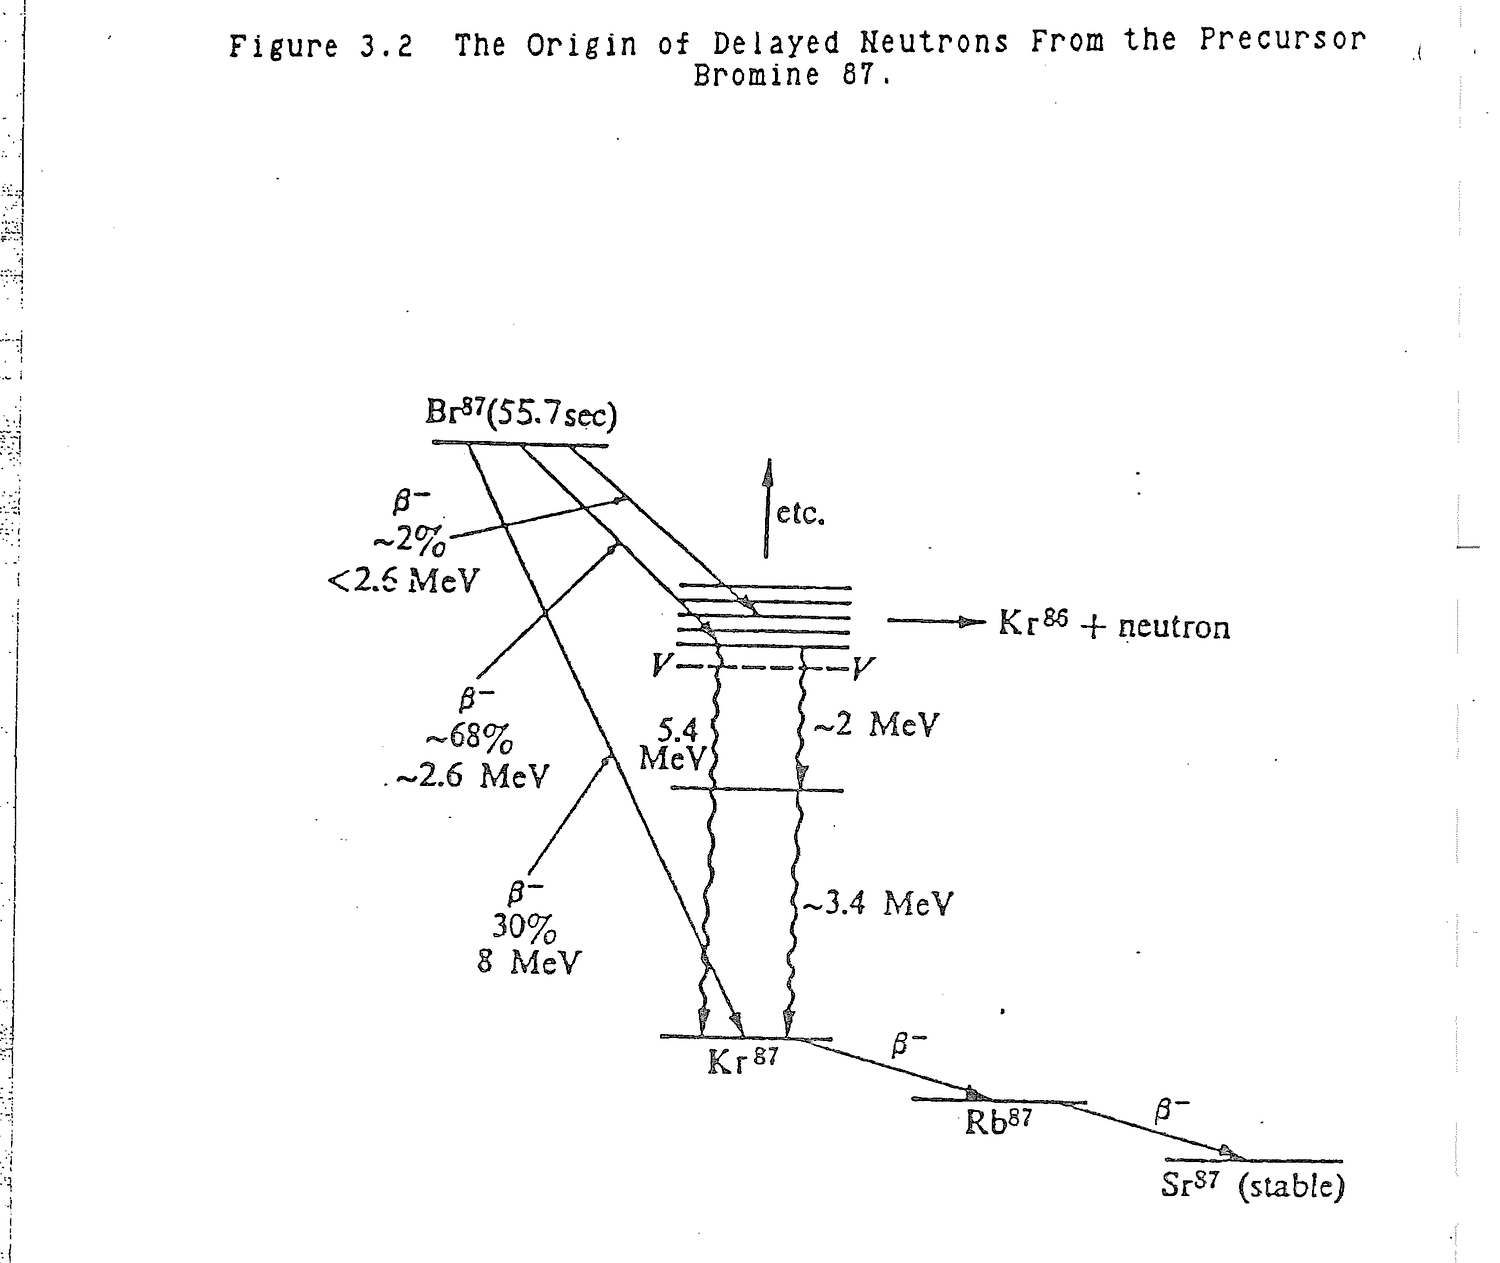
decay by neutron emission to krypton-86. The remainder decay by gamma emission, called isometric transition, to ground state krypton-87. Ground state krypton-87 decays by beta emission to rubidium-87 which in turn beta decays to strontium-87. The delayed neutron does not come directly from bromine-87, but from the so called daughter product, krypton-87.
Define delayed neutron.
A delayed neutron is emitted during the decay of select radioactive fission products. Delayed neutrons do not come directly from fission products, but from fission product daughters.
Define the delayed neutron fraction, β.
β = core delayed neutrons/core prompt + delayed
    neutrons

  = core delayed neutrons/total core neutrons
Verify the value of β = 0.0065 in Table 3.4 for U235
Delayed neutrons/fission = 0.0158

Prompt neutrons/fission = 2.42 (Table 3.1)

β = 0.0158/(0.0158 + 2.42)

  = 0.0065
During reactor operation, uranium-235 is consumed and plutonium-239 and plutonium-241 are formed. The resultant core delayed neutron fraction is the weighted average of the constituent delayed neutron fractions. The power generated by the reactor at beginning of life comes from U235 thermal fission and U238 fast fission. Later in core life, larger and larger fractions of power generation are produced by Pu239 fission and Pu241 fission.
βcore = Σ Piβi (3.1)
where:
Pi = Fraction of power generated by isotope i.
At the beginning of life, approximately 98% of reactor power is generated by U235 fission and 2% by U238 as a result of fast fission. If β for U235 is 0.0065 and for U238 is 0.0157, calculate the delayed neutron fraction for the core as a whole.
βcore = 0.98 β235 + 0.02 β238

      = (0.98)(0.0065) + (0.02)(0.0157)

      = 0.0064 + 0.0003

      = 0.0067
The delayed neutron fraction, β, is the fraction of delayed neutrons in the core at birth, that is, at high or fast energies. The effective delayed neutron fraction, βeff, is the same fraction at thermal energies, that is, once a given generation has slowed down and become thermalized.
In general, delayed neutrons are born at lower energies than prompt fission neutrons. Prompt neutrons are born between one and ten MeV, with an average energy of 2 MeV. Delayed neutrons are born between 0.3 and 0.9 MeV with an average energy of 0.4 MeV. Delayed neutrons traverse a smaller energy range in slowing down to become thermal. They are less likely to be lost by leakage and parasitic absorption than are prompt neutrons. On the other hand, prompt neutrons are more likely to cause fast fission as they slow down and are absorbed in the higher energy ranges. These two effects tend to counteract each other. As a result, though the effective delayed neutron fraction in most reactors is somewhat greater than the delayed neutron fraction at birth, the difference is quite small.
The preceding discussion is illustrated in Figure 3.3. At birth there are 9,935 prompt neutrons in the core and 65 delayed neutrons. β is .0065. In the process of slowing down, a larger fraction of prompt neutrons is lost, 26%, than delayed neutrons, 14%. The resultant βeff of .0075 is greater than β.
Define the effective delayed neutron fraction, βeff.
βeff is the ratio of delayed to total core neutrons once they have slowed down to thermal energies.
In a nuclear reactor, fast neutrons from fission of uranium-235 or plutonium-239 undergo a process of energy reduction called thermalization, absorption in other fissile uranium-235 or plutonium-239 nuclei and production of a succeeding generation of fast neutrons by fission of some of the absorbing nuclei. This sequence, repeated generation after generation, is the chain reaction that sustains the power level in a reactor. Figure 3.4 is a diagrammatic representation of a single generation showing the various events that can affect a neutron as it passes through a generation.
For a power reactor, list representative values of the six multiplication factors.
Fast fission factor, ε                        1.10

Fast non leakage probability, LF             0.95

Resonance escape probability, P               0.75

Thermal non leakage probability, LTH         0.98

Thermal utilization factor, f                 0.70

Reproduction factor, η                        2.05 (≈2)

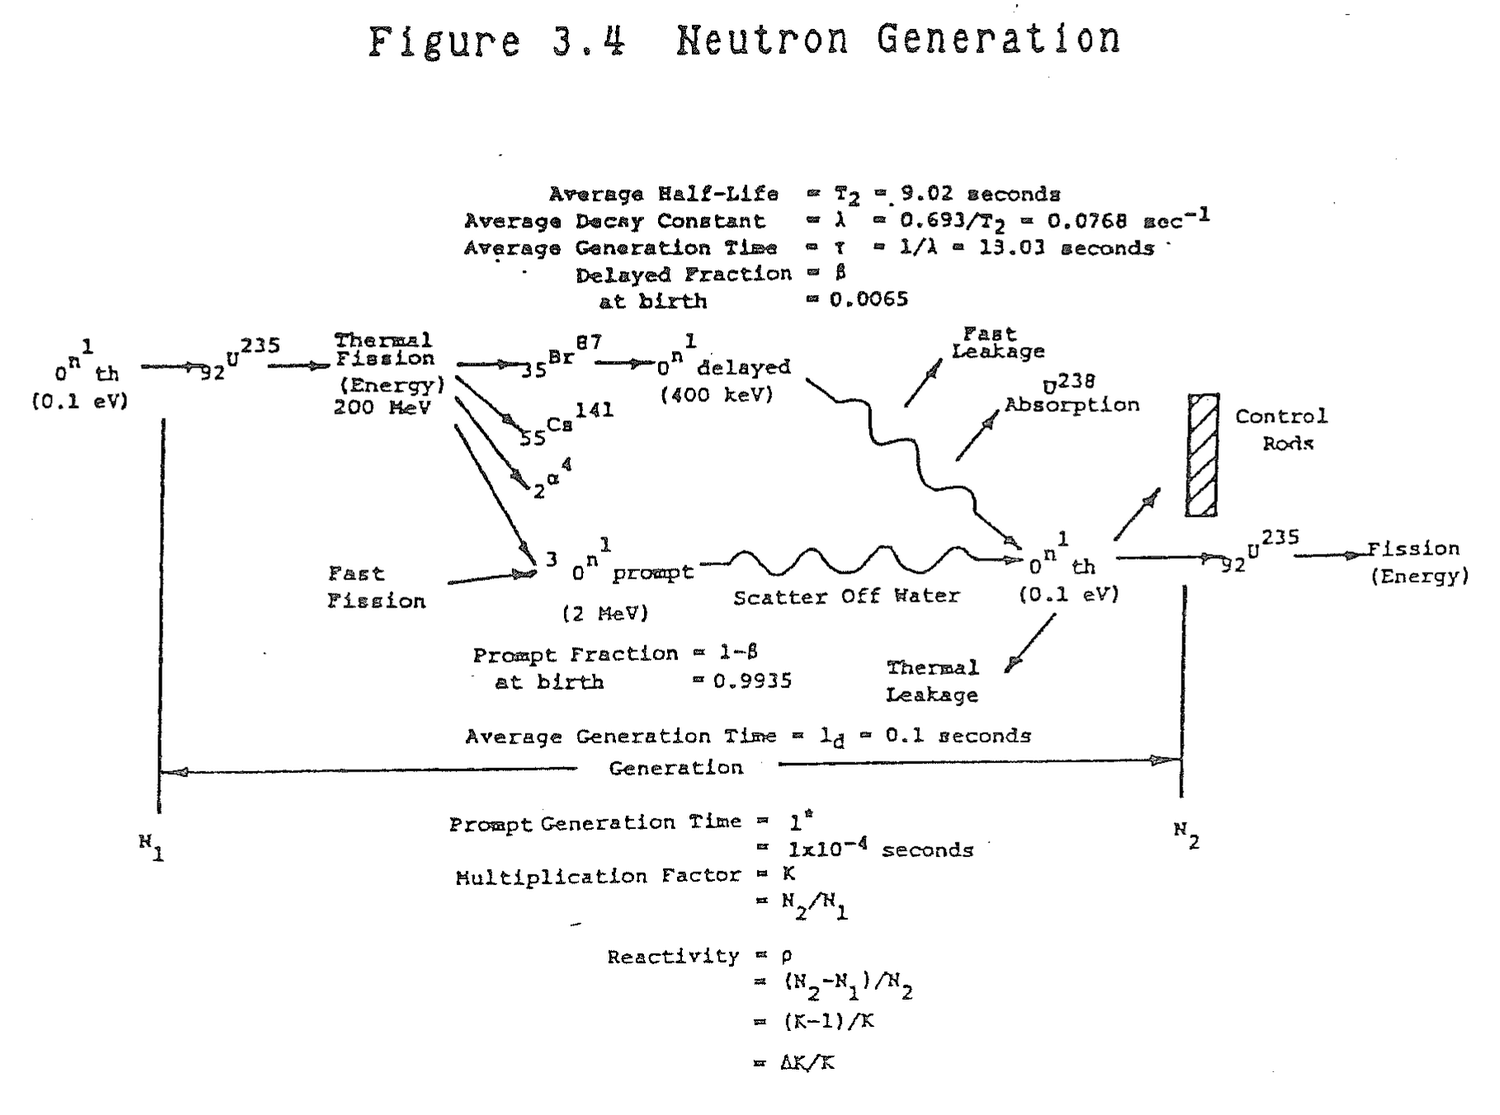
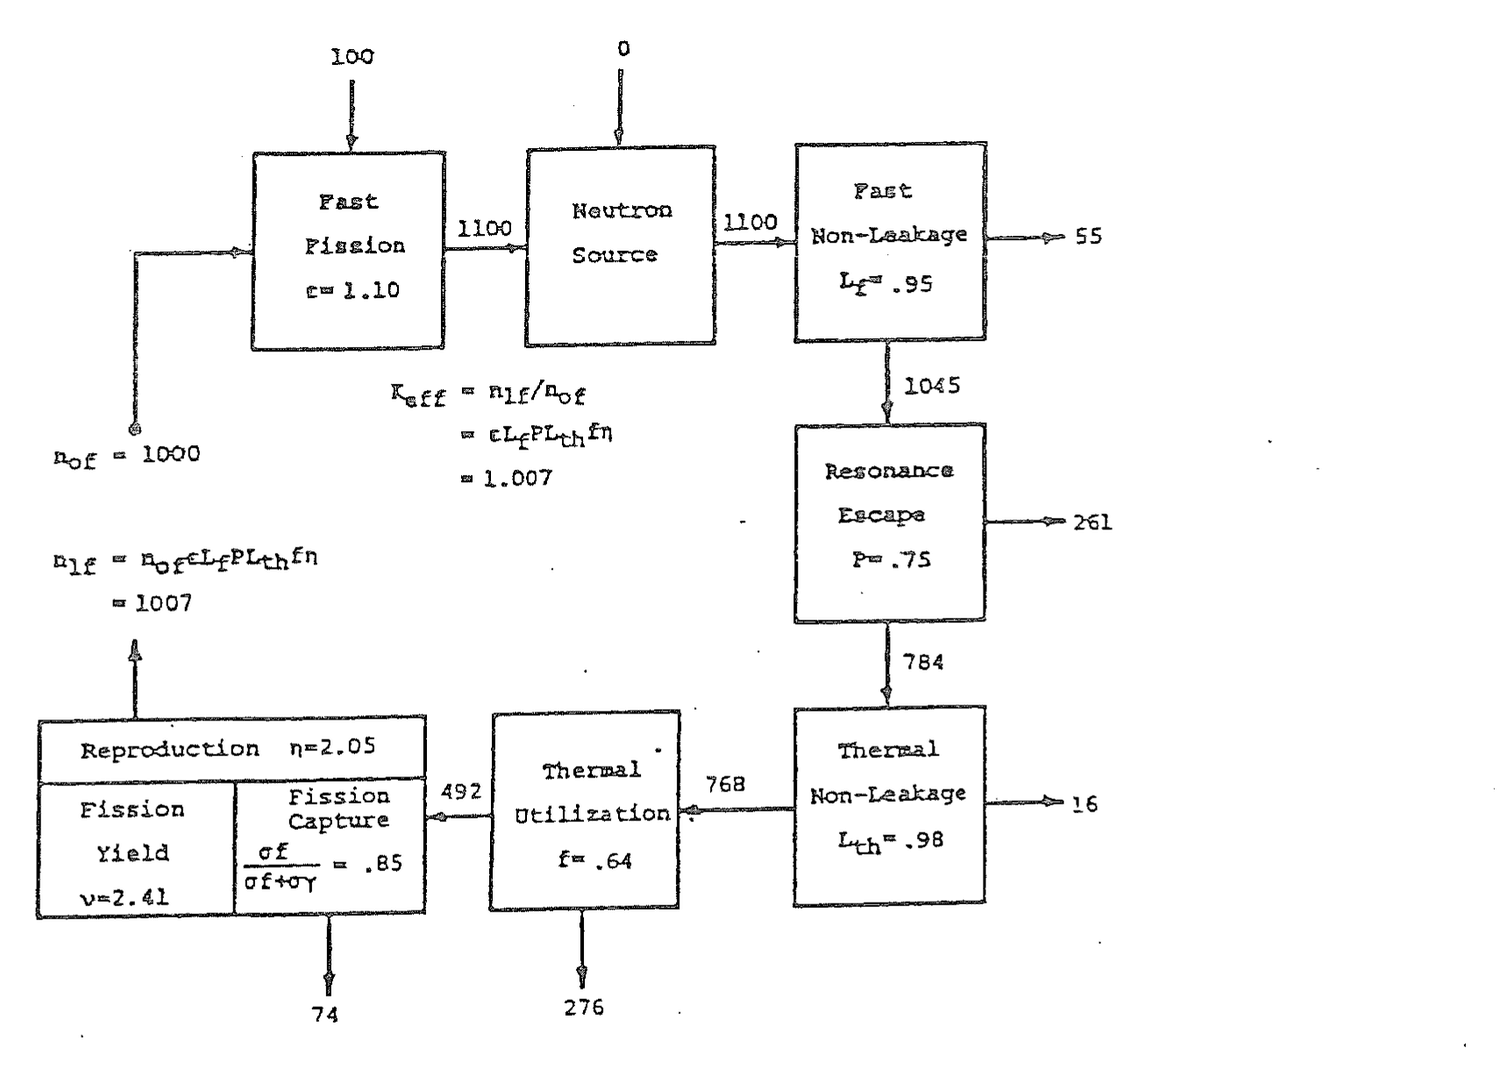
In a neutron generation, the prompt fission neutrons in one generation, nof, in Figure 3.4, undergo multiplication to produce prompt fission neutrons in the succeeding generation, n1f. The multiplication factor between generations, Keff, is the cumulative product of all the neutron production and loss mechanisms that occur in a generation.
Keff = n1f/nof                                                (3.2)

     = nof ε Lf P Lth f η/nof

     = ε Lf P Lth f η                                          (3.3)
where:
  ε = Fast fission factor

    = (Fast neutrons from all fissions)/(Fast neutrons
      from thermal fission)

 Lf = Fast non leakage probability

    = (Fast neutrons that start to slow down)/
      (Fast neutrons from all fissions)

  P = Resonance escape probability

    = (Neutrons that reach thermal energy)/
      (Fast neutrons that start to slow down)

Lth =  Thermal non leakage probability

    = (Thermal neutrons absorbed in fuel and core
      materials)/ (Neutrons that reach thermal energy)

  f = Thermal utilization factor

    = (Thermal neutrons absorbed in fuel)/
      (Thermal neutrons absorbed in fuel and core
       materials)

    = (Nfσf)/(Nfσf + Ncmσcm)                                  (3.4)

  η = Reproduction factor

    = (Fast neutrons produced by thermal fission)/
      (Thermal neutrons absorbed in fuel)
The product of these six terms, called the six factor formula for Keff, has units of (Fast neutrons produced by thermal fission in one generation)/(Fast neutrons produced by thermal neutrons in the preceding genertion) which is the multiplication between generations. The reproduction factor can be divided into two parts.
η = (σf/(σf + σc))ν (3.5)
where:
σf/(σf + σc) = Fission capture factor

                = (Thermal neutrons that cause fission)/
                  (Thermal neutrons absorbed in fuel)

              ν = Fission yield

                = (Fast neutrons produced by thermal fission)/
                  (Thermal neutrons that cause fission)
In a very large reactor which can be viewed as infinite in size, neutron leakage does not exist. The non leakage probabilities become unity. Keff in equation (3.3) reduces to
K∞ = ε P f η (3.6)
or the so called four factor formula.
The value of each of the six factors shown in Figure 3.4 is representative for a light water power reactor. After
prolonged reactor operation, the fast fission and reproduction factors will change slightly because of consumption of uranium 235 and uranium 238 and production of plutonium 239, plutonium 240, and plutonium 241. Each of these isotopes has specific cross sections and fission yields. But, during very short intervals of reactor operation and during power changes or transients when rapid effects on neutron multiplication are of concern, the factors are effectively constant.
The remaining four factors vary routinely to determine the mutliplication between generations.
Define the effective multiplication factor, Keff.
Keff is the multiplication factor by which the neutron population in a reactor core increases or decreases between generations.
Differentiate between a finite and an infinite reactor.
An infinite reactor is not subject to thermal and fast leakage. LTH = LF = 1
LF = 1
Which of the six factors are least affected by short term reactor transients?
Fast fission and reproduction factors.
Fuel burnup has a long term effect on Keff, but is of no consequence during short term and transient operation. Using Table 3.1, the change in the reproduction factor can be calculated. For uranium-235, the value is 2.05. For plutonium-239, the reproduction factor increases to 2.07. As uranium-235 is consumed in the reactor, plutonium-239 is formed and becomes a source of fission. Thus, the reproduction factor increases, but the increase is so slight as to be considered negligible.
The major effect of fuel burnup is on thermal utilization. The number density of fuel, Nf, is in both the numerator and the denominator of equation (3.4), but the denominator has an additional core material macroscopic cross
section which remains essentially constant. As fuel is depleted, both the numerator and denominator decrease, but the numerator undergoes a greater fractional decrease which causes an overall decrease in f.
In order to compensate for fuel burnup, the rods are withdrawn. This decreases the denominator in f which tends to restore it toward its original value.
Moderator temperature increase causes a reduction in moderator density which reduces the number of water molecules in the core. As a result of this, the mean free path between scattering collisions increases so the average neutron travels a greater distance in slowing down and being absorbed by fuel. This increased travel makes the possibility of the neutrons exiting the core more likely, so the thermal and fast non leakage probabilities decrease. In traveling greater distances, neutrons are more likely to be absorbed by uranium-238 and plutonium-240. Thus, resonance escape probability decreases. A secondary effect of this phenomenon is an increase in rod worth.
Fuel temperature increase effects are negligible. The reactor experiences almost no change in uranium-238 and plutonium-240 resonance absorption with fuel temperature change. The so-called Doppler coefficient is caused by a decrease in self-shielding in fuels with very high uranium-238 and plutonium-240 densities as fuel temperature increases. Ford Nuclear Reactor fuel with its very low uranium and plutonium densities of about ten atom percent has negligible self-shielding. Aluminum is the dominant material in the meat of the fuel. Fast non leakage probability decreases slightly as fuel temperature increases because of a reduction in fast neutron absorption, but that effect also is negligible.
Poison addition to the reactor is the final general factor affecting neutron multiplication. Poisons can be in the form of boron in control rods; xenon and samarium fission products; or any absorbing nucleus that is introduced into the reactor. Poisons increase the denominator in the thermal utilization factor making the overall value of f decrease. In the case of resonance absorbers, resonance escape probability also decreases.
In general, each of the phenomena described: fuel burnup, moderator temperature increase, fuel temperature increase, and poison addition, result in a decrease in the reactor multiplication factor, Keff, if means are not taken to compensate.
Describe the effects of fuel burnup on neutron multiplication and how it is compensated for.
Reproduction factor increases slightly but remains effectively constant. Thermal utilization factor decreases as fuel is depleted. Rods are withdrawn (BWR) or chemical shim diluted (PWR) to restore the thermal utilization factor and maintain criticality.
Describe the effects of moderator temperature increase on neutron multiplication.
Slowing down length and diffusion length increase. Thermal non leakage, fast non leakage, and resonance escape probabilities decrease. As a secondary effect, rod worth increases.
Describe the effects of poison additions on neutron multiplication.
Thermal utilization factor decreases. For resonance absorbers, resonance escape probability also decreases.
A nuclear reactor is self-sustaining or critical when the number of neutrons in one generation, nof, is equal to the number of neutrons in the succeeding generation, n1f. Under these circumstances, from equation (3.2), Keff = 1. If each succeeding neutron generation decreases, Keff <1 and the reactor is subcritical. If each succeeding generation increases, Keff >1 and the reactor is supercritical.
Define reactor criticality.
Keff = 1. The neutron population in one generation equals the neutron population in the succeeding generation.
Reactivity, ρ, is defined as the fractional change in neutron population per generation.
ρ = (n1f - nof)/n1f                                              (3.7)

  = (Keff nof - nof)/Keff nof

  = (Keff -1)/Keff
The relationship between Keff and reactivity is shown in Table 3.5. The values of reactivity come directly from equation (3.7). When the reactor is critical, Keff = 1 and ρ = 0. For a supercritical reactor Keff >1 and reactivity is positive. In a subcritical reactor, Keff <1 and reactivity is negative.
Reactivity is more convenient to use than Keff for situations, for example, where rods are moved from one position to another. The change in reactivity is calculated by subtracting the reactivity in the initial condition, ρ1 = (K1-1)/K1 from the final reactivity, ρ2 = (K2-1)/K2. The difference is found by forming a common denominator, K1K2, and eliminating all possible terms.
Δρ = ρ2-ρ1

   = (K2-K1)/K2K1                                              (3.8)
Define reactivity.
Reactivity is the fractional change in neutron population between generations.
ρ = (N1 - N0)/N1

  = (KeffN0 - N0)/KeffN0

  = (Keff - 1)/Keff
State the range of values of Keff and ρ for supercritical, critical, and subcritical reactors.
                            Keff          ρ
                           -----        -----

Supercritical                >1           +

Critical                      1           0

Subcritical                  <1           -
Define reactivity in pcm.
Pcm stands for percent milli which numerically equals 10-2x10-3 = 10-5.
For example,
= 0.00010 = 10x10-5 = 10 pcm

= 0.01000 = 1,000x10-5 = 1,000 pcm
Pcm is used at some reactors PWRs because reactivity insertion values are generally quite small and pcm allows reactivity to be written in manageable whole numbers.
Table 3.5  Criticality, Keff and Reactivity

                Subcritical        Critical        Supercritical

Keff                  <1                1               >1

Reactivity, ρ    (-)              (0)              (+)
Develop an expression for a change in reactivity, Δρ, in terms of K.
ρ1 = (K1-1)/K1

ρ2 = (K2-1)/K2

Δρ = ρ2-ρ1

   = (K2-1)/K2-(K1-1)/K1

   = (K2K1-K1-K1K2+K2)/K2K1

   = (K2-K1)/K2K1
An important quantity in reactor kinetics is neutron lifetime, l, the average time between the release of a neutron in a fission reaction and its loss from the system by absorption or escape. For convenience of calculation, the lifetime in a thermal reactor may be divided into two parts: (a) slowing down time, the mean time required for fission neutrons to slow down to thermal energies, and (b) diffusion time, the average time that thermal neutrons diffuse before being lost in some way. Table 3.6 provides values of these parameters for several different media.
What is the difference between neutron generation time and neutron lifetime.
Generation time is the time between succeeding neutron generations and is the sum of fission time, slowing down time, and diffusion time.
Neutron lifetime is the time from birth of a neutron to absorption and is the sum of slowing down time and diffusion time.
Since fission time is very short, of the order 10-14 seconds, the numerical values of generation time and lifetime are almost equal. As a result, they are often used interchangeably.
Calculate the neutron lifetime for water.
Lifetime = Slowing Down Time + Diffusion Time

         = 7.1x10⁻⁶ + 2.4x10⁻⁴ sec

         = 2.47x10⁻⁴ sec

         ≈ 1x10⁻⁴ sec
Define migration length.
Migration length is the straight line distance that a neutron travels in its lifetime, that is, while slowing down and diffusing.
Prompt neutron generation time, l*, is nearly equal in value to neutron lifetime. The fission event is included in generation time, but it is extremely short, 1x10-14 seconds.
Using the values in Table 3.6 for water, the prompt generation time is 2.47x10⁻⁴ seconds. Values ranging from 5x10⁻⁵ to 5x10⁻⁴ seconds are sometimes used, but a reasonable, representative value is: l* = 1x10⁻⁴ seconds. Physically, this means that 10,000 generations of prompt neutrons are produced every second in a light water reactor.
Suppose that Keff = 1.001 in a reactor operating at a full thermal power level of 3300Mw. In one second, at a generation rate of 10,000 per second, reactor power level would be approximately 72,325,000 Mw. A value of Keff = 1.001 is quite small so it is apparent that a reactor which was dependent upon prompt neutrons alone would be uncontrollable.
What is a typical value of prompt generation time, l*?
l* ≈  Neutron Lifetime

   ≈  1x10⁻⁴ sec
Table 3.6  Slowing Down and Diffusion Times
  For Thermal Neutrons in an Infinite Medium

---------------------------------------------------------------------------
                   |   1/mfp    |   Slowing Down Time   |   Diffusion Time
   Moderator       |  Σs(cm-1)  |         (sec)         |        (sec)
---------------------------------------------------------------------------
Water..........    |    1.40    |      7.1 × 10⁻⁶       |     2.4 × 10⁻⁴
Heavy water.....   |    0.35    |      5.0 × 10⁻⁵       |     6.0 × 10⁻²
Beryllium.......   |    0.75    |      5.7 × 10⁻⁵       |     4.2 × 10⁻³
Graphite........   |    0.41    |      1.4 × 10⁻⁴       |     1.6 × 10⁻²
---------------------------------------------------------------------------
If reactor generation time were l* ≈ 1x10⁻⁴ sec, how many generations occur in one second?
Generations = 1 sec/1x10-4 sec/gen

            = 10,000 gen
Suppose Keff = 1.0001 in a reactor with a generation time, l* = 1x10⁻⁴ sec. Calculate the change in reactor power in one second.
P = P0(Keff)(Keff)(Keff).......10,000 generations

  = P0(Keff)10,000

P/P0 = (Keff)10,000

     = (1.0001)10,000

     = 2.72
For the example above calculate reactor period, T, and start-up rate, SUR.
P/P0 = e

     = (Keff)gen

  e = 1.0001gen

    = e(ln 1.0001)gen = e.0001 gen

  1 = .0001 gen

gen = 10,000

  T = l* gen

    = (1x10⁻⁴ sec/gen) (10,000 gen)

    = 1.0 sec
In one minute, gen = 600,000

P/P0 = (Keff)gen

      = (1.0001)600,000

      ≈ 1x1026

  SUR ≈ 26 dpm
Delayed neutron generation time, τ, is the weighted average of the mean generation times of the six delayed neutron precursors. Table 3.7 is a compilation of delayed neutron data for uranium 235 from Table 3.4.
The decay constant, λi, is the average precursor decay rate. The inverse of the decay constant, τi = 1/λi, is the mean precursor generation time. Individual precursor generation times are weighted by the appropriate values of βi, summed and divided by the total delayed neutron fraction to obtain τ.
τ = Στiβi/β                                                    (3.9)

  = .0848/.0065

  = 13.05 seconds
The weighted decay constant, λ = 1/τ ≈ .08 sec-1, for delayed neutrons will be useful later.
Delayed neutrons are a small fraction of all neutrons in the core, but they have a dominating effect on reactor time response. This is best illustrated by calculating a weighted neutron generation time, ld.
ld = ((1-βeff) l* + βeff τ)/((1-βeff) + βeff) (3.10)
The effective delayed neutron fraction, βeff, is used in equation (3.10) because it is this relative number of delayed neutrons actually reaching thermal energies and causing fission that measures the impact on reactor control. Since the total fraction of core neutrons is one, the denominator of equation (3.10) is one. Also, since βeff is small, the numerator term (1-βeff) is approximately equal to one. Equation (3.10) becomes
Table 3.7  Uranium 235 Delayed Neutron
         Mean Generation Time


                                                                     Weighted
                Decay        Mean Generation      Precursor         Generation
Precursor     Constant            Time            Fraction,           Time,
  Group      λi(sec-1)      τi=1/λi(sec)          βi           τiβi(sec)
---------    ----------    -----------------    -----------       ------------

    1          .0124            80.4              .000215            .0173

    2          .0305            32.8              .001424            .0467

    3          .111              9.0              .001274            .0115

    4          .301              3.3              .002568            .0085

    5         1.14               0.9              .000748            .0007

    6         3.01               0.3              .000273            .0001
                                                  -------            -----

                                            β = .0065    Στiβi = .0848
ld = l* + βeff τ
                                                                    (3.11)

Substitution of numerical values yields

ld = 1x10⁻⁴ + (.0075)(13)

   = .0001 + .0975

   = .0976

ld ≈ 0.1 second                                                  (3.12)
Inspection of the numerical values shows that l*<<βeff τ, so equation (3.11) can be further reduced to
ld = βeff τ

   = βeff/λ                                                      (3.13)
Return to the example in section 3.3.6. Using the weighted neutron generation time, ld = 0.1 seconds, in one second, ten generations will occur. For a reactor starting at 3300 Mw with Keff= 1.001, in one second, reactor power would be 3300 (1.001)10 = 3333 Mw. Such a rate of power change is easily controlled. The final power of 3333 Mw can be contrasted with the value of 72,325,000 Mw calculated previously where the generation was caused by prompt neutrons alone.
Define delayed neutron generation time.
Delayed generation time, τ, is the weighted average of the mean generation times of the six delayed neutron precursors.
What are steady state, supercritical, and subcritical values of delayed neutron generation times. Why do these values vary?
                                  τ (sec)
                                  -------

Supercritical                       10

Critical                            13

Subcritical                         20
The supercritical and subcritical values are approximate and will vary with the amount of positive or negative reactivity.
During a positive reactivity addition (supercritical), the shortest lived delayed neutron precursors are formed more rapidly than the longer lived precursors. As a result, τ shortens to 10 seconds.
In a subcritical reactor, the longer lived precursors do not decay as rapidly as the shorter lived precursors. τ increases to 20 seconds.
Define and evaluate the weighted delayed neutron decay constant, λ.
λ = 1/τ

                                  τ(sec)              λ(1/sec)
                                  ------              --------

Supercritical                       10                   .1

Critical                            13                   .08

Subcritical                         20                   .05
Define and evaluate the reactor weighted generation time, ld
ld = ((1-βeff)l* + βeff τ)/((1-βeff) + βeff)

   = (1-βeff)l* + βeff τ

   ≈ l* + βeff τ

   ≈ (1x10⁻⁴ sec) + (.0075)(13 sec)

   ≈ .0001 + .0975

   ≈ .0976 sec

   ≈ 0.1 sec

   ≈ βeff τ

   ≈ βeff/λ
How can delayed neutrons that are so few in number affect reactor control?
Generation time determines reactor period or startup rate. The shorter the generation time, the shorter the period and greater the startup rate for a positive reactivity addition. Prompt generation time, l* ≈ 1x10⁻⁴ sec. Delayed generation time, τ ≈ 13 sec. The weighted average of the two from the preceding example, is ld ≈ 0.1 sec. Though small in number, delayed neutrons increase reactor generation time by a factor of 1,000. Periods and startup rates are proportionately increased and decreased for positive reactivity additions making the reactor more capable of being controlled.
Suppose Keff = 1.0001 in a reactor with a weighted generation time, ld = 0.1 sec. Calculate the change in reactor power in one second.
Generation = 1 sec/0.1 sec/gen

           = 10 gen

      P/P0 = (Keff)gen

           = (1.0001)10

           = 1.001
3.4.1 One frequently hears the following terms around a reactor. If these pairs of terms mean the same thing, mark your answers as SAME. However, if the pairs of terms do not mean the same thing, then explain the difference.
(a) Fast neutrons and prompt neutrons;
(b) Slow neutrons and delayed neutrons;
(c) Activity and reactivity.
Solution:
(a) Fast neutrons are high energy neutrons (>1 MeV). Prompt neutrons are those that occur directly from the fission reaction.
(b) Slow neutrons are low energy neutrons (<.625 eV). Delayed neutrons are those that occur indirectly from fission through fission fragment daughter decay.
(c) Activity is the number of disintegrations per unit time of a radioisotope. Reactivity is the fractional change in neutron population per generation, (K-1)/K.
3.4.2 Briefly describe how delayed neutrons are produced.
Solution:
Delayed neutrons are produced from the radioactive decay of certain fission products and their daughters.
3.4.3 (a) Beta for U-235 is 0.0065. Why is Beta effective approximately 0.007?
(b) How does this difference affect reactor period?
Solution:
(a) Beta effective is greater than beta because delayed neutrons are born at lower energies than prompt neutrons so a larger percentage of the delayed neutrons will become thermal neutrons and cause fission. To account for this larger percentage at the thermal neutron level than at the fast neutron level we use the effective delayed neutron fraction rather than the delayed neutron fraction in our calculations.
(b) This difference produces a longer period for a given addition of reactivity which can be seen in the reactor period equation, T = (β-ρ)/λρ. With beta effective used instead of beta, the term (βeff-ρ) is larger giving a longer period.
3.4.4 The generation time for prompt neutrons is approximately 1x10⁻⁴ sec. How is it possbile for the slow acting control system to control a chain reaction?
Solution:
l* = 1x10⁻⁴sec

 τ = 13 sec

 β = .0075

ld = l*(1-βeff) + τβeff

   = (1x10⁻⁴)(.9925) + (13)(.0075)

   = .0976
Delayed neutrons are a minute fraction of all core neutrons in a critical reactor, but their large lifetime (τ) increases the average core neutron lifetime from l* to ld, making the reactor controllable.
3.4.5 Suppose a reactor had a βeff of 1.0% instead of the usual, and 0.1% reactivity was added to the core. Would the resulting period be longer or shorter? Explain.
Solution:
The resulting period would be longer. The reason for this can be seen using the formula for period, T = (βeff-ρ)/λρ. βeff is increased from 0.75% to 1.0% so the quantity, (βeff-ρ) will increase in the numerator and the period will be longer.
3.4.6 For the following neutron life cycle, calculate the fast fission factor, fast non-leakage probability, resonance escape probability, thermal non-leakage probability, thermal utilization factor, reproduction factor, Keff, and core reactivity.
1000 fast (thermal fission) neutrons;
  20 fast (fast fission) neutrons;
  40 fast neutrons lost by leakage;
 120 neutrons absorbed in U-238;
  80 thermal neutrons lost by leakage;
 302 thermal neutrons absorbed in poisons, moderator
     and core materials;
  75 thermal neutrons undergo nonfission capture in
     U-235 and U-238;
1006 fast neutrons are produced by thermal fission to
     start the next generation.
Solution:
   ε = 1020/1000 = 1.02

  LF = 980/1020 = 0.96

   P = 860/980 = 0.88

 LTH = 780/860 = 0.91

   f = 478/780 = 0.61

   η = 1006/478 = 2.10

Keff = 1006/1000 = 1.006

   ρ = K-1/K = .006
3.4.7 What term in the Keff formula is most affected by:
(a) The control rod moved in:
(b) Moderator temperature rise of 10 degrees;
(c) U-235 burnup.
Solution:
(a) f = thermal neutrons absorbed in fuel/thermal neutrons absorbed in fuel and core materials
(b) Lf = number of fast neutrons that start to slow down in the core/number of fast neutrons produced from all fissions
Lth = number of thermal neutrons absorbed in core materials/number of neutrons that reach thermal energy
P = number of neutrons that reach thermal energy/number of neutrons that start to slow down.
(c) f
3.4.8 What happens to the neutron flux as fuel depletion occurs?
Solution:
As fuel depletion occurs, the neutron flux peak flattens in the center and broadens out toward the edges of the core. Since the total reaction rate, Σfφ, in the core must remain constant, flux will tend to shift to higher values in parts of the core with more fuel and decrease in depleted parts of the core. In order to compensate for fuel depletion, rods are withdrawn or boron is diluted. Flux levels tend to increase in the areas where the rods had been surpressing flux.
3.4.9 Explain neutron generation time.
3.4.10 How and why does beta change over core life?
3.4.11 Describe the effect on reactor control and response as beta changes over core life.
3.4.12 Explain why beta is different for different fissile isotopes.
3.4.13 Describe how a moderator temperature change will effect the worth of a control rod.
3.4.14 Write the six factor formula and define each term. Explain the changes that would take place in each factor from hot zero power to hot full power.
3.4.15 There are 1000 neutrons in a particular generation of which 993 are prompt neutrons and 7 are delayed neutrons. There were 995 neutrons (total) in the preceeding generation.
(a) What are prompt and delayed neutrons?
(b) Is the reactor subcritical, critical, or supercritical? Explain your answer.
(c) How do the 7 delayed neutrons affect the control of a reactor? Use the above case as an example.
3.4.16 (a) How is plutonium-239 formed in the reactor core?
(b) How does it affect core reactivity? Explain.
(c) How does it affect the beta fraction? Explain.
3.4.17 What difference, if any, is there between K∞ and Keff?
3.4.18 (a) Distinguish between average neutron generation time and average neutron lifetime.
(b) Explain the difference between average generation time for delayed and prompt neutrons and where this is involved in reactor operation
3.4.19 How much power is produced in the core by the fissioning of U-238? Explain.
3.4.20 Define the following terms:
(a) Thermal diffusion length;
(b) Neutron migration length;
(c) Slowing down length.
What factors affect the value of each term?
3.4.21 (a) What is the relationship between (1) the neutron generation time, (2) the slowing down time of the fast fission neutrons and (3) the diffusion time or lifetime of the thermal neutrons?
(b) What are the approximate values for your reactor for (1) and (2) above?
3.4.22 Given the following parameters for an infinite core; ε = 1.03, P = 0.9, f = 0.74, η = 1.5 and N0 = 1000:
(a) How many fast neutrons are gained in this generation;
(b) How many neutrons reach thermal energy;
(c) How many thermal neutrons are absorbed in the fuel?
This page of the original is blank apart from its running header and page label.
Reactor Kinetics involves analysis of the dynamic behavior of a nuclear reactor: prompt criticality and supercritical behavior and delayed criticality and supercritical behavior.
After studying the lesson material and working exercise problems, the student should be able to:
1. Define prompt critical, delayed critical, reactor period, source critical, and decay heat.
2. Solve problems for prompt and delayed critical reactors involving reactor period, power, positive and negative reactivity, prompt jump, and prompt drop.
3. Describe the limits of positive and negative reactivity with regard to prompt criticality, delayed criticality, and minimum shutdown period.
4. Describe neutron power level and decay heat following reactor scram.
In a normal, critical reactor, the neutron fractions are divided between βeff delayed neutrons and (1-βeff) prompt neutrons. The multiplication factor, Keff, reflects the change in prompt and delayed neutrons in each generation. An equilibrium, critical reactor is illustrated in Figure 4.1.a. Since only the fraction (1-βeff) is prompt neutrons, it follows that as far as prompt neutrons are concerned, the reactor multiplication factor is (1-βeff)Keff. If (1-βeff)Keff is made equal to or greater than unity, self sustaining neutron multiplication occurs due to prompt neutrons alone. The reactor is said to be prompt critical. The prompt critical condition, (1-βeff)Keff = 1, is illustrated in Figure 4.1.d. The delayed neutron fraction is not actually zero, but can be viewed as being zero because delayed neutrons are not necessary to maintain reactor criticality and, in this prompt critical condition, they have no impact on reactor control. Solving the preceding equation for Keff yields:
Keff = 1/(1-βeff) (4.1)
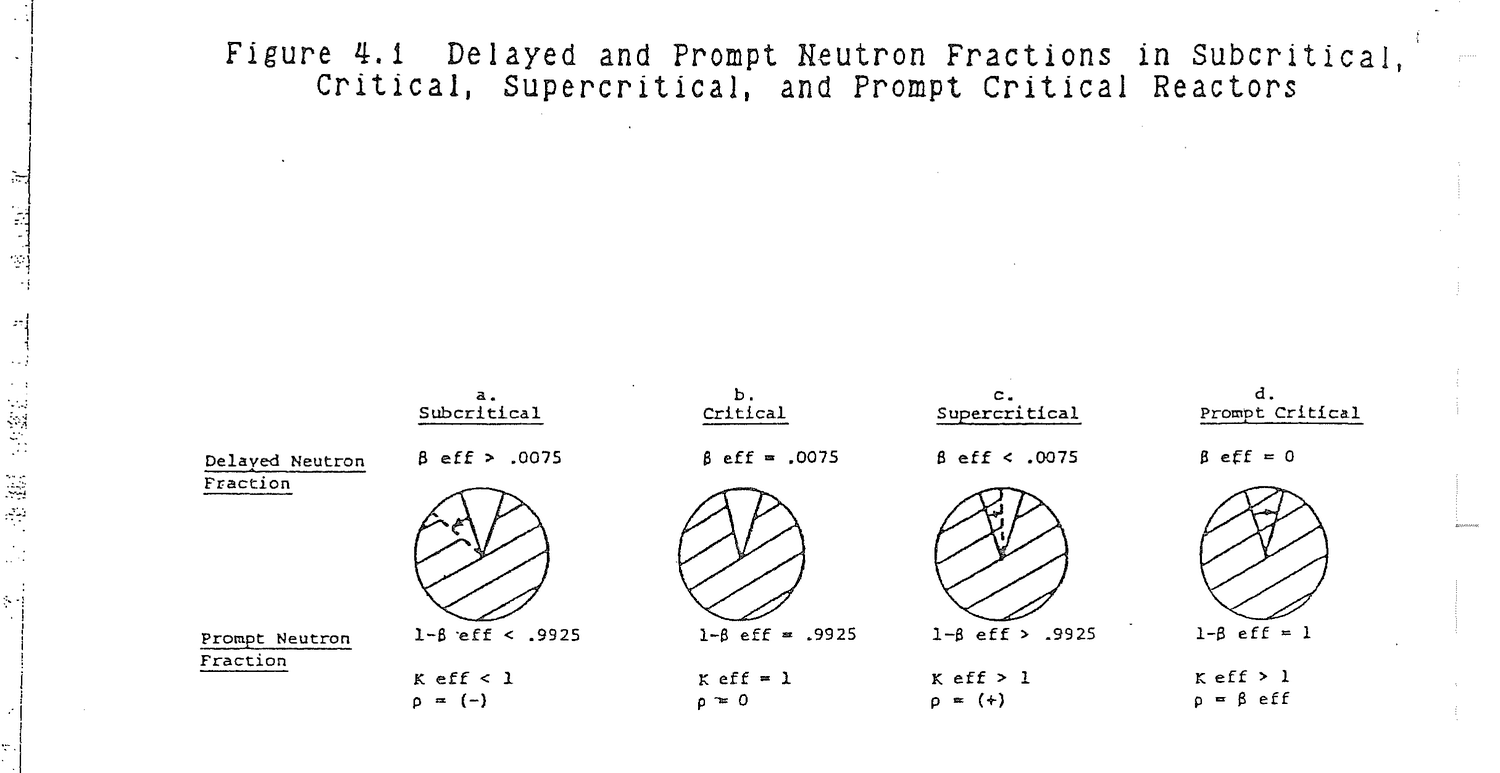
which can be related to reactivity by solving the reactivity equation for Keff.
Keff = 1/(1-ρ) (4.2)
Equate (4.1) and (4.2) to show that:
ρ = βeff
                                                            (4.3)
which is the minimum amount of reactivity that must be inserted to produce prompt criticality.
The time rate of change of neutron population in a prompt critical reactor is:
dN/dt = (Keff-1)N/l*          neutrons/second          (4.4)

      = (ΔK/l*)N
where:
(Keff-1)N = Change in neutron population per
             generation, neutrons/generation.
         l* = Prompt neutron generation time, 1x10⁻⁴
             seconds/generation.
     Keff-1 = ΔK
The exact solution to equation (4.4) is:
N(t) = N(0)e(ΔK/l*)t (4.5)
Neutron population and reactor power are equivalent since neutrons react with fuel nuclei to cause fission which produces power. Equation (4.5) can be written in terms of reactor power level, P, as:
P(t) = P(0)e(ΔK/l*)t (4.6)
Equation (4.6) can be used to calculate reactor power in a prompt critical reactor at any time following the start of a transient. Use the example from an earlier chapter: P(0) = 3300Mw, Keff = 1.001, ΔK = .001, t = 1 second. The power level after a one second transient is:
P(1) = 3300e(.001/1x10-4)1

     = 72, 687, 337 Mw
Define prompt critical.
ρ = βeff. The reactor is critical or self sustaining on prompt neutrons alone.
Reactor period, T, is defined as the time in seconds required to increase or decrease reactor power by a factor of e(2.718). Reactor period is illustrated graphically in Figure 4.2. In one period, reactor power starting at an initial value, P0, increases to P0e for positive reactivity additions and P0/e for negative additions. In two periods, power increases or decreases by e2; in three periods by e3; in four periods by e4. Mathematically, this is expressed as:
P(t) = P(0)et/T (4.7)
For a prompt critical reactor, equation (4.7) can be compared to equation (4.6). Since both express reactor power as functions of time, they are equal at any particular time for the same initial power. Setting them equal and comparing terms means that 1/T = ΔK/l* or:
T = l*/ΔK (4.8)
which is the reactor period in a prompt critical reactor in terms of prompt generation time, l*, and ΔK.
A practical range for positive supercritical values of Keff in a reactor is 1 through (1+βeff) which corresponds to a ΔK range of 0-βeff. If Keff is greater than (1+βeff), the reactor is prompt critical, uncontrollable, and it makes little difference how much additionally Keff is increased.
For the small range of ΔK, reactivity is nearly equal to ΔK, as can be seen in Table 4.1, so ρ = ΔK is a reasonable approximation. In Table 4.1, the value .0075 is assigned to βeff, though βeff will vary from reactor to reactor.
Using the approximation, ρ = ΔK, the prompt critical period becomes:
T = l*/ρ (4.9)
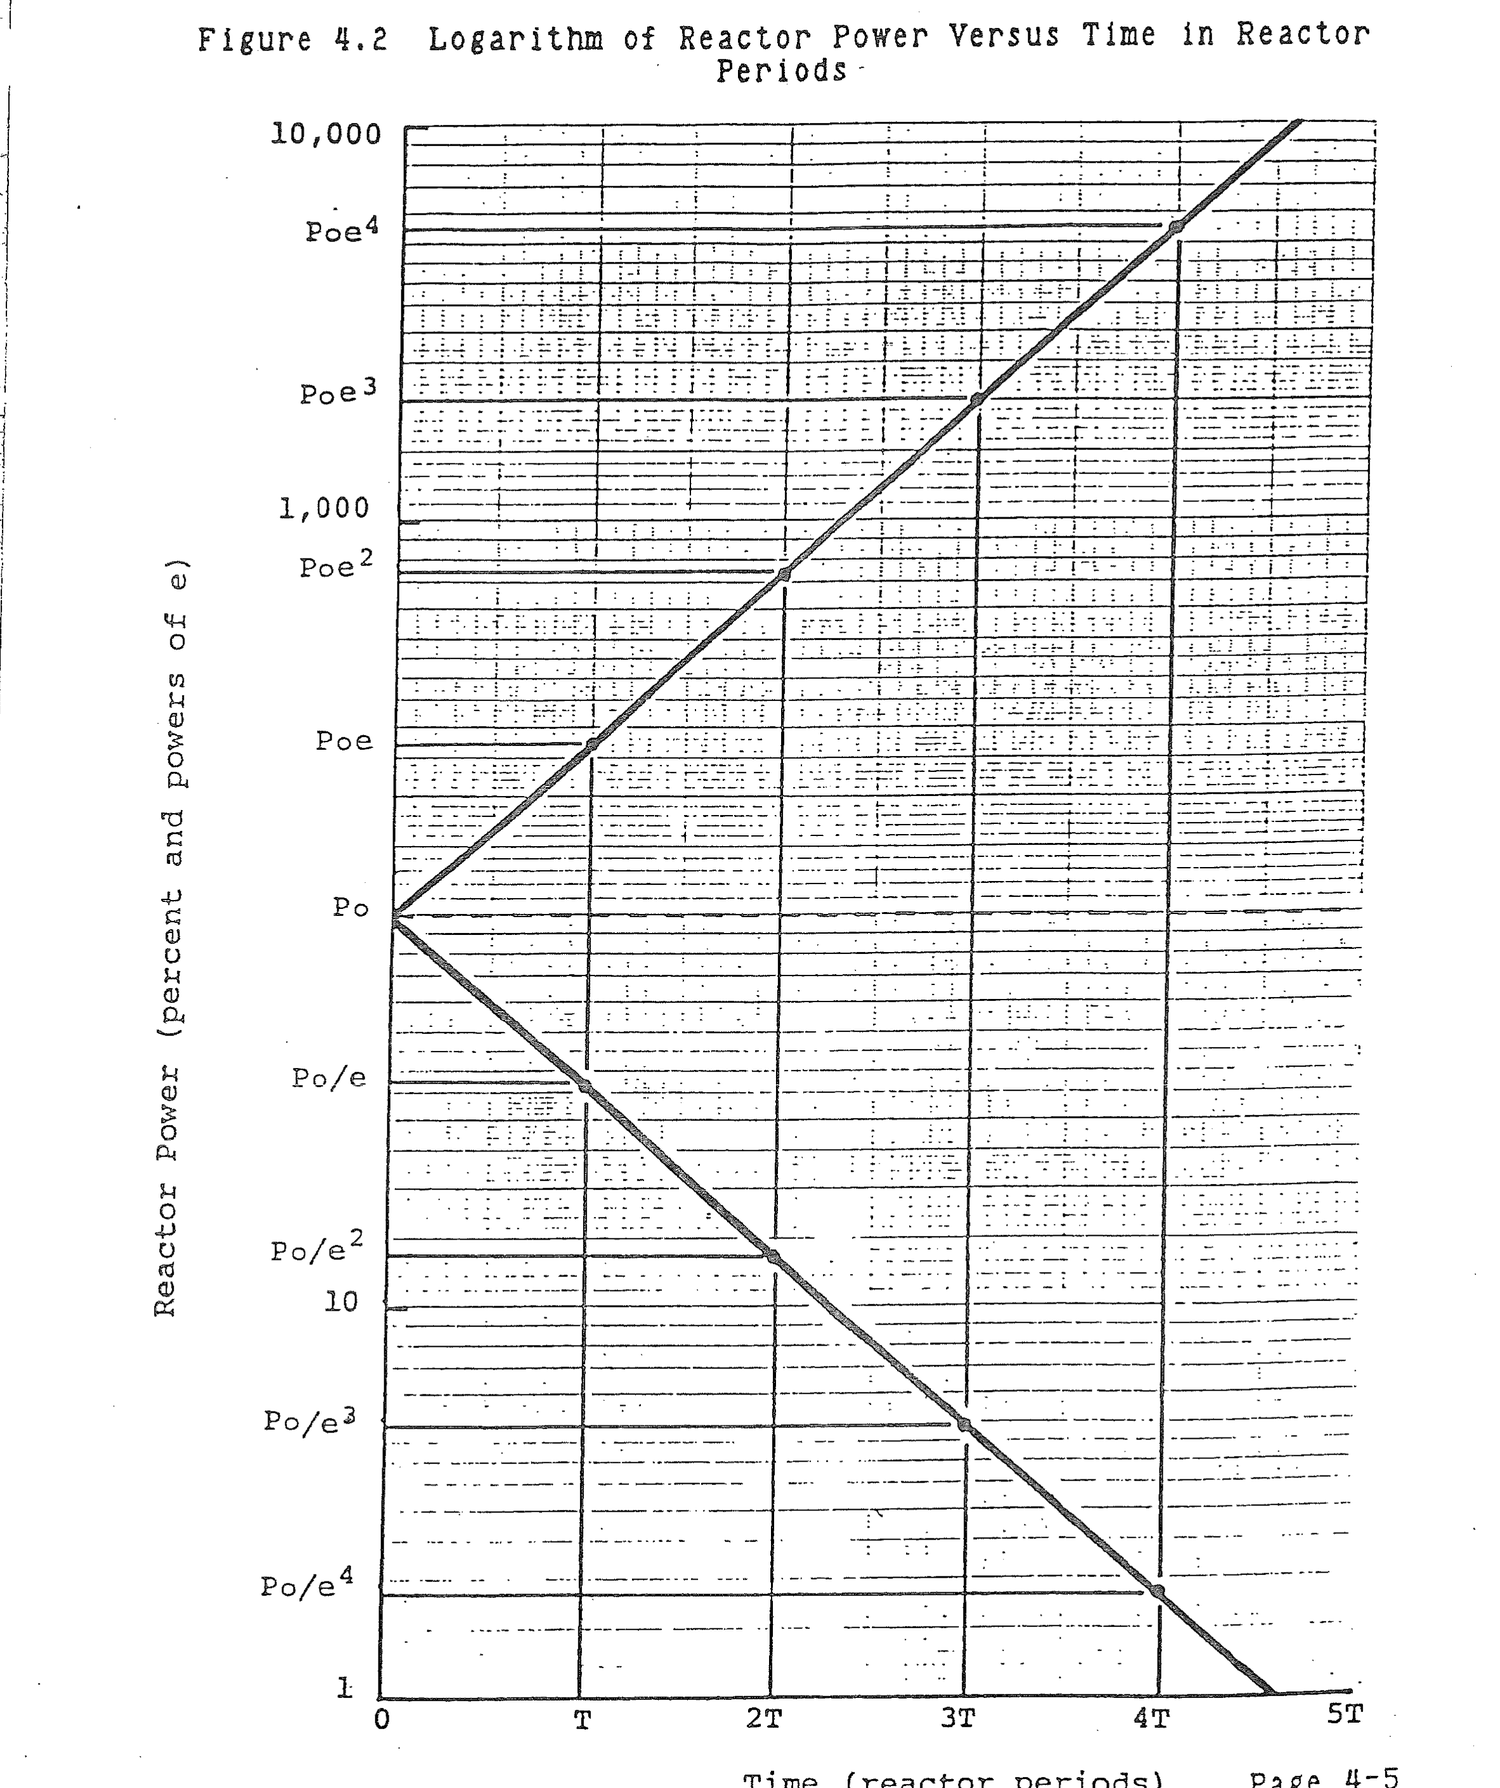
Table 4.1 Keff, ΔK, and ρ Values For Keff Ranging Between 1 and (1+βeff) Where βeff = .0075
Keff                  ΔK                    ρ
----                  --                  -----

  1                    0                    0
1.001                .001                 .001
1.005                .005                 .005
1.0075               .0075                .0074
Keff = 1.0001 in a hypothetical prompt critical reactor.
(a) Determine the reactivity.
ρ = Keff-1/Keff

  = (1.0001-1)/1.0001

  = 0.0001 ΔK/K

  ≈ Keff-1

  ≈ ΔK
(b) Calculate the reactor period, T
T = l*/ρ

  = (1x10⁻⁴sec)/(1x10-4dK/K)

  = 1 sec
(c) Calculate the factor by which reactor power changes in one second.
P = P0et/T

P/P0 = et/T

  = e1/1

  = e
which is the same answer obtained for an identical problem in Chapter 3 that was solved using generation multiplication.
For all practical positive reactivity additions from zero to prompt critical, the approximation ρ = ΔK is valid. Is the approximation valid for negative reactivity additions?
No, for large negative reactivity additions. For example, when Keff = 0.9,
ρ = (0.9-1)/0.9

  = -0.111

ΔK = 0.9-1

   = -0.100

ΔK-ρ = -0.100-(-0.111)

     = 0.011
which is a large difference in reactivity.
Define reactor period.
Period is the time in seconds required to change reactor power by a factor of e.
Return to Chapter 3 and the weighted neutron generation time which includes both prompt and delayed neutrons. Since the denominator is unity, weighted generation time can be written:
ld = (1-βeff)l*+βeffτ (4.10)
As positive reactivity is added to the reactor, the effects, in terms of time response and generation time, of prompt neutrons are enhanced and the effects of delayed neutrons are diminished. In Figure 4.1.c, the delayed neutron fraction effectively decreases in proportion to the positive reactivity added to the reactor while the prompt neutron fraction increases. This action can be accounted for in equation (4.10) by adding reactivity to the prompt neutron fraction and subtracting reactivity from the delayed neutron fraction.
ld = (1-βeff+2r1)l* + (βeff-ρ)τ (4.11)
Equation (4.11) can be initially simplified by observing that ρ<βeff<<1, so (1-βeff+ρ)≈1.
ld = l*+(βeff-ρ)τ (4.12)
Table 4.2 compares l* with (βeff-ρ)τ for reactivities ranging from zero to .0074.
It can be seen that even for ρ = .0074, l* is less than 8% of (βeff-ρ)τ. So, for practical use, l* can be dropped from equation (4.12)
ld = (βeff-ρ)τ (4.13)
and remembering that λ = 1/τ:
ld = (βeff-ρ)/λ (4.14)
In equation (4.9), replace l* with ld.
T = ld/ρ

  = (βeff-ρ)/λρ                                     (4.15)
which is the period equation for a delayed critical reactor.
Return to the delayed critical example from Chapter 3. For a delayed critical reactor with K = 1.001, ΔK ≈ ρ = .001, and an initial power level of 3300Mw, T = (.0075-.001)/(0.1)(.001) = 65 seconds.
In one second, reactor power would be P(1) = 3300e1/65= 3351 Mw.
Keff = 1.0001 in a delayed critical reactor.
(a) Calculate the reactor period.
T = (βeff-ρ)/λρ

  = (0.007-0.0001)/(0.1)(0.0001)

  = 690 sec
Note that λ≈0.1 for a positive reactivity addition.
Table 4.2 l* as a Fraction of (βeff-ρ)τ for Reactivities Ranging From Zero to .0074 Where βeff = .0075
ρ l* (βeff-ρ)τ l*/((βeff-ρ)τ) ------ ------ ----------- --------------- 0 .0001 .0975 .0010 .001 .0001 .0845 .0012 .005 .0001 .0325 .0031 .007 .0001 .0065 .0154 .0074 .0001 .0013 .0769
(b) Determine the factor by which reactor power changes in one second.
P/P0 = et/T
= e1/690
= 1.001
Which is the same answer obtained for an identical problem in Chapter 3 that was solved using generation multiplication.
During the time that reactivity is being inserted in a reactor, a transient period exists that differs from the stable period. Transient reactor period is conveniently expressed as,
T = (βeff - ρ)/(λρ + Δρ/Δt) (4.16)
where:
Δρ/Δt = Reactivity addition rate, ΔK/K/sec.
Inspection of equation (4.16) shows that when reactivity is being added to the reactor, such as during rod withdrawal, reactor period is shorter than the stable period that will result once rod withdrawal is stopped. Thus, during the time that rods are being withdrawn, reactor power will increase more rapidly than when rod withdrawal is stopped. The reason for this behavior is delayed neutron generation. During rod withdrawal, prompt neutrons and the shortest lived delayed neutrons generate most rapidly. The reactor tends toward prompt critical. As rods continue to be withdrawn, multiplication of the longer lived delayed neutrons is never able to catch up to multiplication of prompt and shorter lived delayed neutrons. Once rod withdrawal, or any other source of positive reactivity addition, ceases, generation of longer lived delayed neutrons begins to catch up to generation of shorter lived delayed neutrons and to bring the overall delayed neutron fraction toward its stable value.
A representative value of the delayed neutron decay constant, λ, during positive reactivity additions is about 0.1. During a time of reactivity addition, the decay constant increases to an even higher value which means that the delayed neutron generation time, τ, shortens, and reactor period shortens.
Equation (4.16) has not been derived mathematically. It is a convenient physical representation of the effect of reactivity addition rate on reactor period. The period actually shortens, as explained, because λ increases. However, for illustrating the transient period effect, equation (4.16) comes in handy.
When negative reactivity is inserted into a reactor, an immediate decrease in the prompt neutron fraction results due to leakage, absorption, and a reduction in the fission rate. The delayed neutron population decreases somewhat due to leakage and absorption, but the generation rate of delayed neutrons remains nearly constant because delayed neutrons are produced by fission product decay and the fission product inventory in the reactor is determined by past power history. Thus, the effective delayed neutron fraction in the core increases as illustrated in Figure 4.1.a. Since delayed neutrons tend to lengthen neutron generation time and a subcritical reactor has an increased delayed neutron fraction, it is reasonable to assume that for equal absolute values of reactivity, negative reactivity additions will produce longer negative periods and positive reactivity will tend to produce shorter positive periods.
In the example in section 4.4, a positive reactivity addition, ρ = .001, resulted in a positive period, T = 65 seconds. The same value of negative reactivity, ρ = -.001, results in a period using equation (4.15), T = (.0075-(-.001))/(.05)(-.001) = (.0075+.001)/(.05)(-.001) = -170 seconds. Algebraic signs must be observed in this calculation in order to obtain the correct answer. Note that λ ≈ 0.05 for negative reactivity additions.
There is a limit to the negative period that can be developed in a reactor by negative reactivity additions. Soon after the insertion of a large amount of negative reactivity such as a scram, the prompt neutron population decreases to a low level. Neutron population is predominantly the result of delayed neutrons which are produced by fission product decay. Within a short time, 2-3 minutes, all of the short lived delayed neutron precursors have decayed away. At this point, and from this point on, the core neutron population is sustained by decay of the longest lived fission product precursor, bromine-87, with a half life of = 55.72 seconds. Since the rate at which core neutron population decreases is determined by radioactive decay of bromine-87, an effective reactor period can be calculated by setting equations (2.9) and (4.7) equal. Neutron population, N will be used to replace activity, A, and power, P, respectively in the two equations.
N(t) = N(0)e-.693t/T2 = N(0)t/T (4.17)
In order for the two exponents to be equal, -.693/T2 = 1/T or:
T = -T2/.693 (4.18)
Substituting the bromine-87 half live of 55.72 seconds yields a limiting negative period, T = -80 seconds. No matter how much negative reactivity is added to a reactor, after the initial reduction in prompt neutrons and the decay of short lived fission products, core neutron population will decrease with a -80 second period. A typical power history following a scram is illustrated in Figure 4.3.
Figure 4.4 illustrates reactor time behavior for relatively small negative reactivity additions such as a routine rod insertion. Because of the decay of bromine-87, the shortest stable negative period is limited to -80 seconds. Equation (4.15) can be solved for reactivity
ρ = βeff/(1+λT) (4.19)
in order to determine the amount of negative reactivity that would precisely cause a -80 second period. For a delayed neutron fraction of .0075, ρ = .0075/(1+(.05)(-80)) = -.0025. For a larger negative reactivity addition, reactor power would still decrease on a stable -80 second period. However, smaller negative reactivity additions result in longer negative periods. In Figure 4.4, a negative reactivity addition, ρ = -.001, results in a period, T = -170 seconds. For small negative reactivity additions, the initial rate of power decrease is more rapid than T = -80 seconds due to the prompt drop in fission neutrons and the decay of short lived precursors, but the effect is not as dramatic, as can be seen in Figure 4.4, as subsequent to a reactor scram.
A reactor is made subcritical by a large negative reactivity insertion.
(a) Determine the stable negative period that is reached during shutdown.
Reactor neutron level is maintained by the decay of delayed neutron sources during shutdown. After the shorter lived fission products decay away, neutron population is maintained by the decay of Br87 with a 55.72 second half life. This decay causes neutron level to decline on an apparent period that is determined by
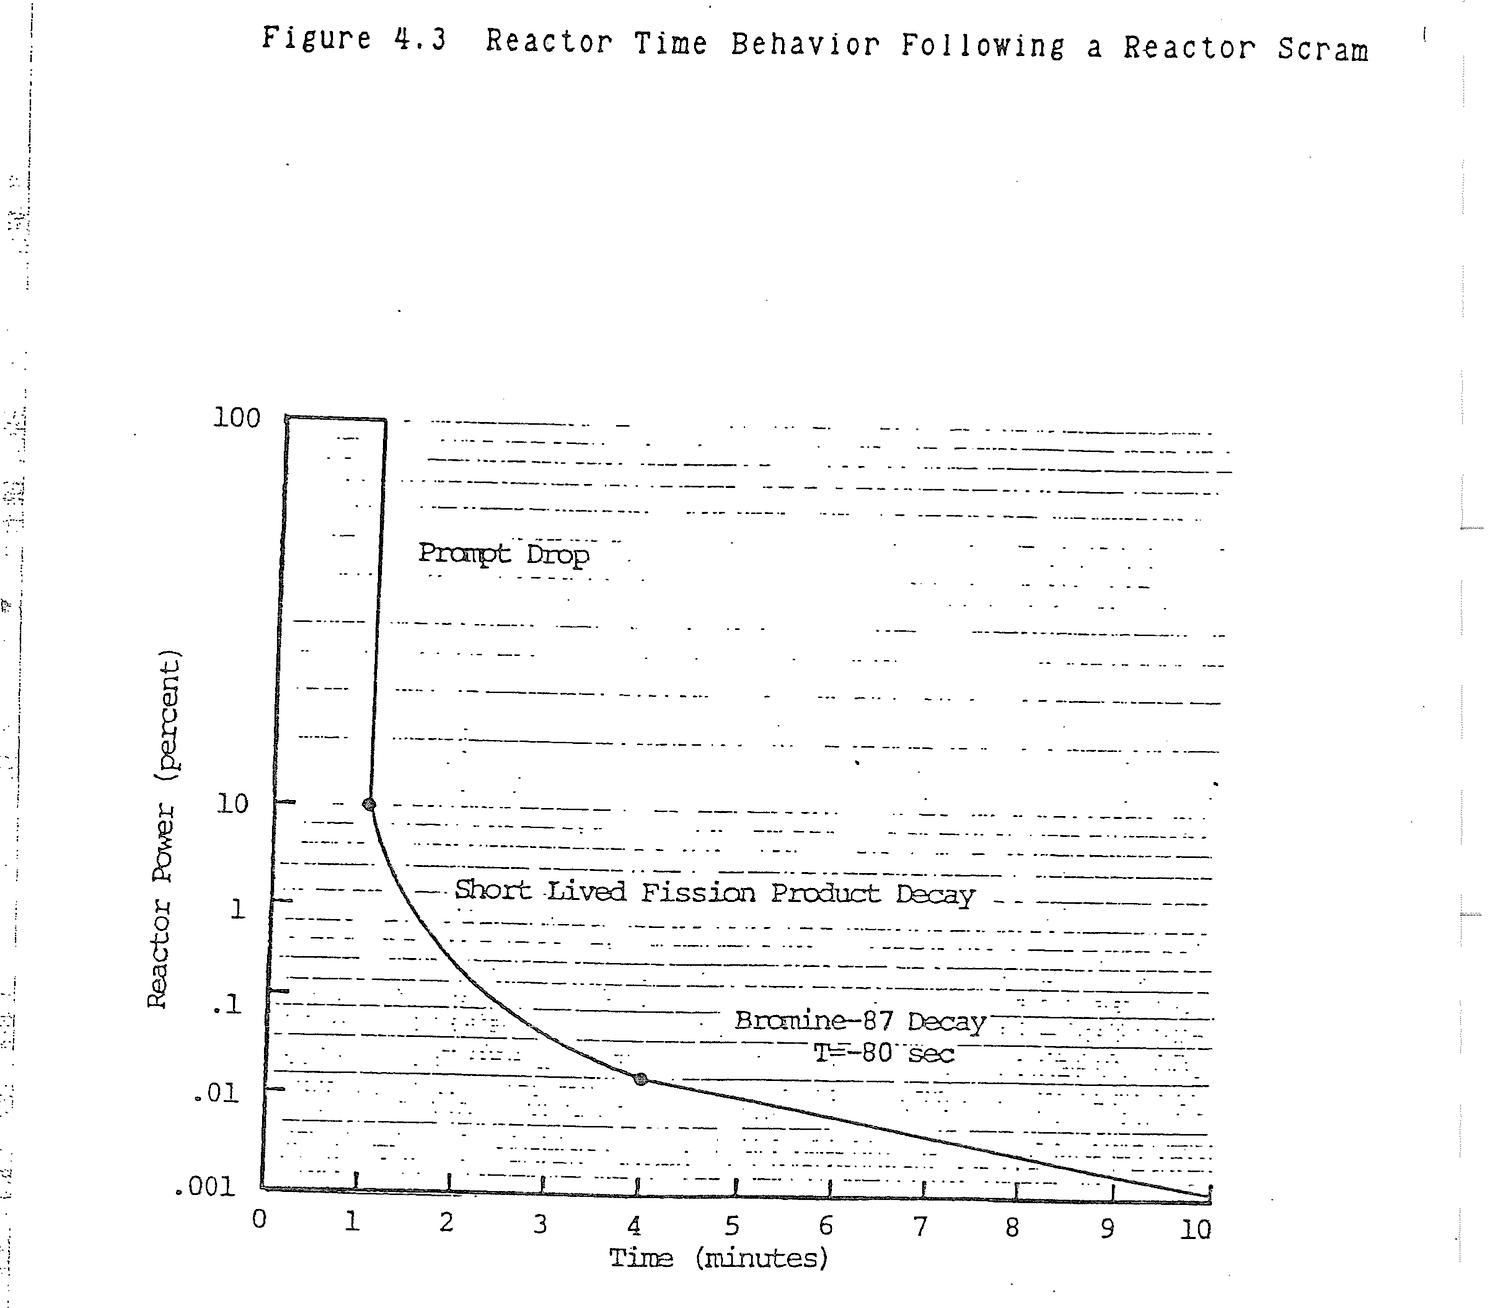

P = P0et/T = P0e-.693t/T2
et/T = e-.693t/T2
t/T = -.693t/T2
T = -T2/.693
= -(55.72 sec)/.693
= -80 sec
(b) How long does it take to establish the stable T = -80 sec after the rods are inserted?
The next longest lived delayed neutron precursor is I137 with a 24.4 second half life. Using the seven half life rule, I137 will decay away to less than 1% of its steady state operating value in 7x24.4 = 171 sec ≈ 3 min.
Determine the reactor period for a negative reactivity insertion, ρ = -0.0001 ΔK/K = -10 pcm.
T = (β-ρ)/λρ = (0.007 - (-0.0001))/(0.05)(-0.0001) = -1420 sec
Note that λ = 0.05 is used for a negative reactivity addition though this value is an estimate and actually corresponds to only one specific value of negative reactivity.
Clear practical limits exist for positive and negative reactivity additions and resulting reactor periods. Though these limits were explained in previous sections, they are reiterated in this section. Table 4.3 is a tabulation of the equations for limiting reactivities and periods. Table 4.4 lists the values of limiting reactivities and periods for βeff = .0075.
When reactivity exceeds βeff, the reactor is prompt critical. Equation (4.5) is used to calculate period which is prohibitively short. When reactivity is less than βeff/(1-80λ), which is equation (4.19) with T = -80, reactor period will be -80 seconds. For reactivity values between these limits, period is calculated using equation (4.15) and will be appropriately positive or negative depending on the reactivity value.
Table 4.3
Limiting Reactivity and Period
Reactivity Limit Reactor Period Reactor
(ΔK/K) (sec) Condition
---------------- -------------- ------------
ρ>βeff T = l*/ρ(1) Prompt Critical
βeff>ρ>0+ T = (βeff-ρ)/λρ(2) Supercritical
ρ = 0 T = ∞ Critical
0->ρ>βeff/(1-80λ)(3) T = (βeff-ρ)/λρ Subcritical
ρ<βeff/(1-80L) T = -80 Subcritical
(1) Equation (4.9)
(2) Equation (4.15)
(3) Equation (4.19)
Table 4.4
Limiting Values of Reactivity and Period for βeff = .0075
Reactivity Period
Limiting Value Limiting Value Reactor
(ΔK/K) (sec) Condition
------------------ ---------------- -----------------
ρ>.0075 T<.013 Prompt Critical
.0075>ρ>0+ .013<T<+∞ Supercritical
ρ = 0 T = ±∞ Critical
0->ρ>-.0025 -∞<T<-80 Subcritical
ρ<-.0025 T = -80 Subcritical
A rod malfunction causes an instant rod ejection that inserts 0.01 ΔK/K reactivity.
(a) Determine reactor period.
T = l*/ρ Prompt critical = (1x10⁻⁴ sec)/0.01 = 0.01 sec
(b) From a starting reactor power of 3,000 MW(t), determine reactor power in one second.
P = P0 10 (SUR)t = 3000 10(2600)(1/60) = (3000)(2.15x1043) = 6.46x1046 Mw
A cold water injection results in a positive reactivity addition of 0.0007 ΔK/K.
(a) Calculate reactor period.
T = (β-ρ)/λρ = (0.007 - 0.0007)/(0.1)(0.0007) = 90 sec
(b) From a starting power of 100 Mw(t), calculate the time required to increase power to 3,000 Mw(t) neglecting all reactivity coefficient effects.
P = P0et/T
et/T = P/P0
t/T = ln (P/P0)
t = T ln (p/P0)
= (90 sec) ln (3,000/100)
= 306 sec
A void forms in the reactor to add negative reactivity of -0.0005 ΔK/K.
(a) Calculate reactor period.
T = (β-ρ)/λρ = (0.007 + 0.0005)/(0.05)(-0.0005) = -300 sec
(b) Determine neutron power after 10 minutes starting from 3,000 MW(t).
P = P0et/T = 3,000 e(10)(60)/-300 = (3,000)(.135) = 405 MW(t)
Even though neutron population decreases, fission product decay heat does not decrease as rapidly.
A rod is inserted for no apparent reason with ρ = -0.005.
(a) Determine reactor period.
T = (β-ρ)/λρ = (0.007 + 0.005)/(0.05)(-0.005) = -48 sec
but, negative period is limited to T = -80 sec by Br87 decay.
A reactor is increasing in power on a 30 second period. Determine the reactivity that was inserted to produce that period.
T = (β-ρ)/λρ ρ = β/(1+λT) = (0.007)/(1+(0.1)(30))
= 0.00180 ΔK/K = 180 pcm
When positive reactivity is added to the core, the reactor experiences a sudden and rapid rise in power level due to an almost immediate increase in the production of prompt neutrons. This effect is called prompt jump and is illustrated in Figure 4.5. For reactivity additions below prompt critical, delayed neutrons appear, the reactor slows its rate of power increase, and a stable positive period is established. Similarly, a prompt drop in power level occurs when negative reactivity is suddenly added to the core. The resultant sudden drop in prompt neutron population is illustrated in Figure 4.3.
The magnitude of prompt jump and drop can be calculated from the following equation.
P1/P0 = (βeff(1-ρ))/(βeff-ρ) (4.20)
where:
P0 = Initial reactor power level
P1 = Power level immediately following a rapid positive or
negative reactivity insertion
For example, suppose a scram occurs in a reactor with a βeff = .0075 and the negative reactivity inserted by the rods dropping is, ρ = -.05 ΔK/K. Then P1/P0 = (.0075(1+.05))/(.0075+.05) = 0.137. Following such a scram, reactor power will drop to 13.7 percent of the starting power level.
Rods worth 0.10 ΔK/K are rapidly inserted into a critical reactor. Calculate the magnitude of the prompt drop in reactor power.
P1/Po = (βeff(1-ρ))/(βeff-ρ)
= (0.007 (1+0.1))/(0.007+0.1)
= 0.072
= 7.2%
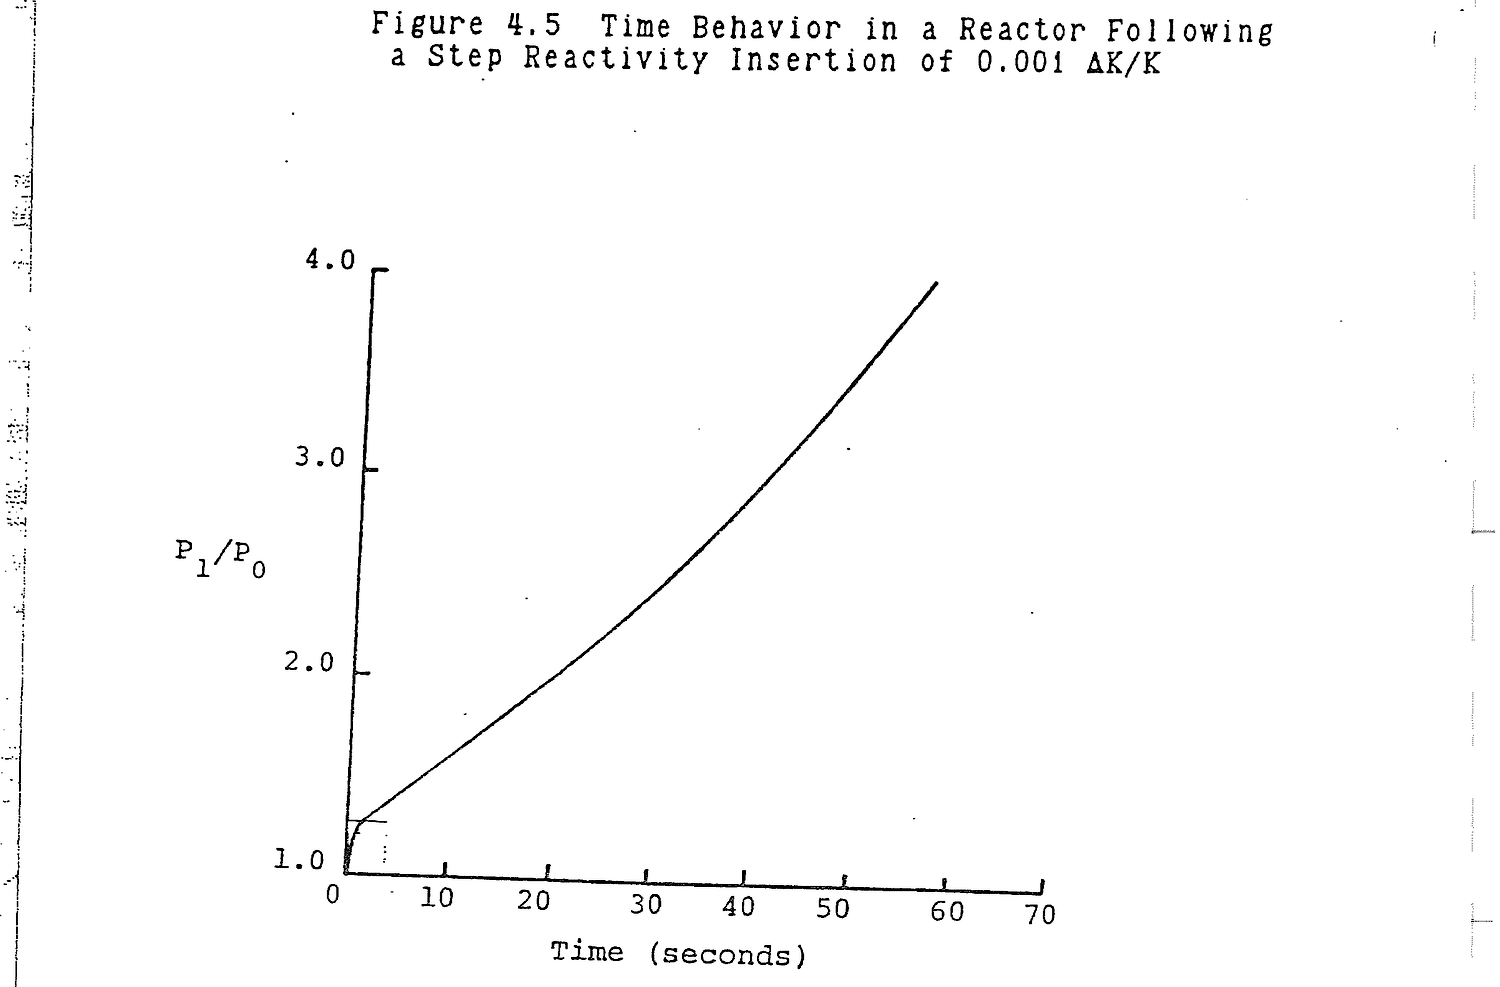
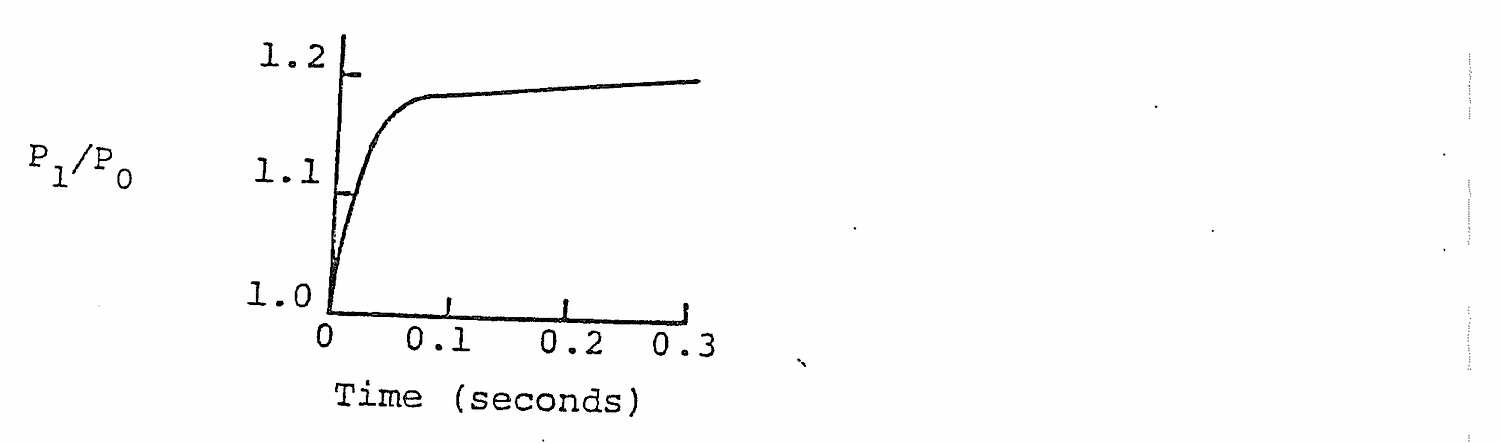
Determine the prompt jump in reactor power as the result of a rapid insertion of ρ = +0.0001 ΔK/K.
P1/P0 = (0.007(1-0.0001))/(0.007-0.0001)
= 1.014
= 1.4% rapid increase
A reactor is source critical if neutrons contributed by an installed neutron source are necessary to make Keff = 1 and to maintain criticality. A neutron source contributes fast neutrons to the generation cycle. If the source is removed from a source critical reactor, the reactor will become subcritical and shutdown.
Define source critical.
A reactor is source critical if Keff = 1 with a neutron source present. If the source is removed, the reactor is not self sustaining on its own neutrons and will shutdown.
Of approximately 200 MeV of recoverable energy released per fission, 8 MeV are in the form of beta particles from fission product decay and 7 MeV are fission product gamma rays. Following a reactor scram, fission power decays with a -80 second period, as shown in Figure 4.3. However, fission product decay heat power is dependent upon past power history and fission product half lives. As shown in Figure 4.6, fission product decay heat power does not decrease as rapidly as fission power level. For this reason, fission product decay heating creates the necessity for emergency core cooling systems following a loss of coolant accident (LOCA) and residual heat removal systems following a long term reactor shutdown.
Table 4.5 lists decay heat power for various times following reactor shutdown. Immediately at shutdown, decay heat is 7.5 percent of operating power. For a power reactor operating at 3300 Mw, that amounts to 248 Mw. Decay heat power decays fairly rapidly for approximately one hour, down to 1.28 percent of operating power, but then decays much more slowly so that, after one year, fission product decay heat still generates 3 Mw in a reactor that had been operating at 3300 Mw.
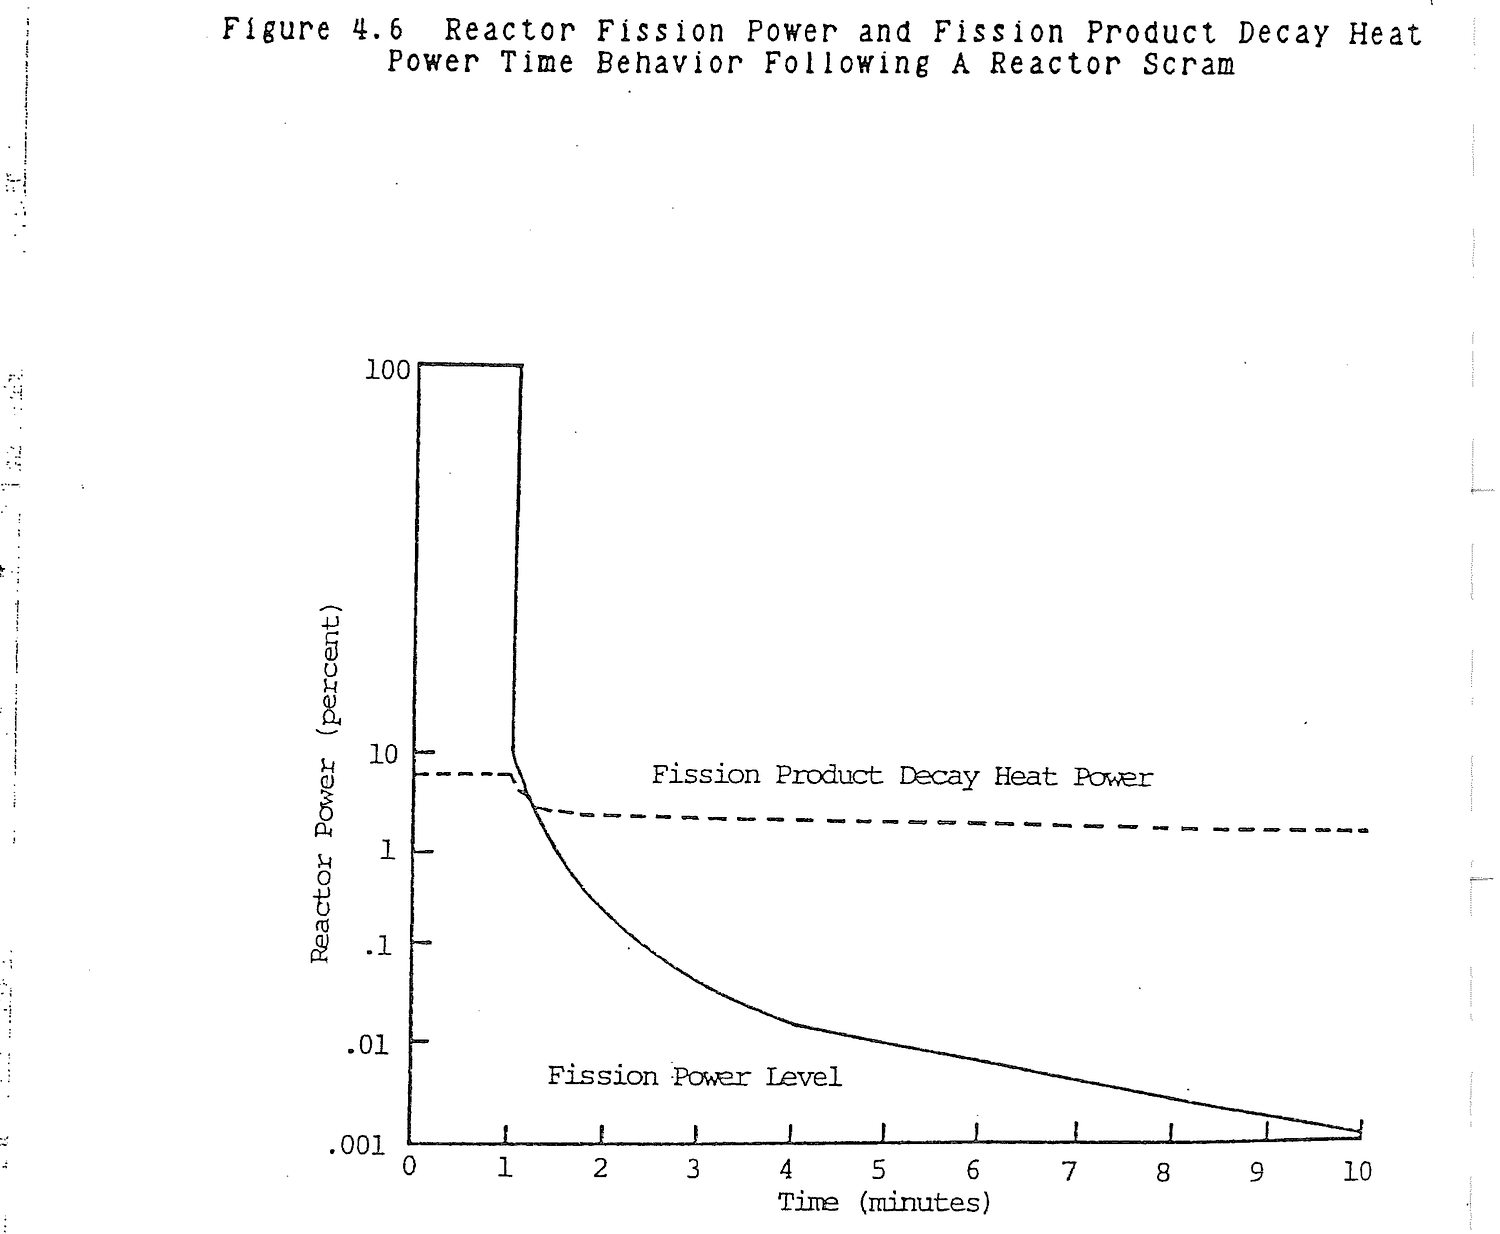
Table 4.5 Fission Product Decay Heat Power Following
Reactor Shutdown
Decay Heat Power Decay Heat Power
Time After As A Fraction Of For An Operating
Shutdown Operating Power Power of 3300Mw
0 .0750 248Mw
0.1 sec. .0675 223
1.0 sec. .0625 206
10 sec. .0500 165
1 min. .0365 120
10 min. .0211 70
30 min. .0157 52
1 hr. .0128 42
12 hr. .0063 21
1 day .0051 17
10 days .0028 9
30 days .0021 7
60 days .0014 5
1 yr. .0009 3
A reactor scram causes indicated power to decrease on a -80 second period. Starting from an initial power of 3000 Mwt, compare indicated and decay heat powers after:
Indicated Power Decay Heat
(Table 4.6)
(a) One minute.
P = 3,000e-60/80 P = (0.0365)(3,000)
= 1,417 Mw = 110 Mw
(b) Ten minutes.
P = 3,000e-600/80 P = (0.0211)(3,000)
= 1.7 Mw = 63.3 Mw
(c) Thirty minutes.
P = 3,000e-1800/80 P = (0.0157)(3,000)
= 5x10⁻⁷ Mw = 47.1 Mw
4.10.1 (a) What is the prompt critical condition?
(b) What value of kex will make a reactor prompt critical?
(c) How is prompt criticality avoided in reactor operation?
Solution:
(a) The prompt critical condition is a reactor that is critical on prompt neutrons alone. This is an unstable and uncontrollable condition.
(b) Kex = β
= .0075 ΔK/K
(c) Limits on the rate of reactivity insertion insure that a rod insertion or scram will be initiated prior to the prompt critical condition. These limits are imposed by:
1. rod withdrawal rates;
2. rod worths.
4.10.2 Explain or define:
(a) Prompt critical;
(b) Delayed critical;
(c) K-effective;
(d) K-infinity;
(e) K-excess.
Solution:
(a) The reactor is critical on prompt neutrons alone. K-effective = 1.0075.
(b) The reactor is being controlled by delayed neutrons. K-effective is between 1.0 and 1.0075.
(c) The multiplication factor of an as built, as operated and as controlled reactor or (Neutrons in one generation)/(Neutrons in the previous generation) for a finite reactor.
(d) The multiplication factor of a hypothetical reactor infinite in size or (Neutrons in one generation)/(Neutrons in the previous generation) for an infinite reactor.
(e) K-excess = K-effective -1.0.
4.10.3 (a) Going through 1 watt on 20 sec. period, how long to 1 Mw?
(b) What is the doubling time?
Solution:
(a) P(t) = 1,000,000
P(o) = 1
T = 20 sec
1,000,000 = 1 et/20
ln(1,000,000) = t/20
t = 20 ln(1,000,000)
= 276.3 sec
(b) P(t) = 2Po
2Po = Poet/T
T = 20 sec
2 = et/20
ln 2 = t/20
t = 20 ln 2
= 13.86 sec
4.10.4 Given the period equation (modified in-hour equation):
T = l*/ρ + (β-ρ)/λρ
(a) Explain the significance of the two parts of the equation.
(b) What would be the period equation for small reactivity additions? Why?
(c) What would be the period equation for large reactivity additions near prompt critical? Why?
(d) What is prompt critical value of reactivity (ΔK/K)?
Solution:
(a) l*/ρ = prompt neutron period
(β-ρ)/λρ = delayed neutron period
(b) T = (β-ρ)/λρ. Delayed neutrons dominate reactor control for small reactivity additions
(c) T = (β-ρ)/λρ for ρ < .0074
T = l*/ρ + (β-ρ)/λρ for ρ > .0074
Even for large reactivity additions near prompt critical, delayed neutrons have a large impact. (Try a calculation)
(d) ρ = β = .0075
4.10.5 A reactor is operating at 100 kw. 0.01% positive reactivity is added to the reactor. What is the resulting period?
Solution:
T = l*/ρ + (β-ρ)/λρ ≈ (β-ρ)/λρ = (.0075-.0001)/(.1)(.0001) = 740 sec
4.10.6 The reactor increased from 2.2 kw to 1.5 Mw on a stable reactor period in 6.5 minutes.
(a) What was the period?
(b) How much reactivity was inserted?
Solution:
(a) P = P0et/T
T = t/ln (P/P0)
T = (6.5x60)/ln(1500/2.2)
= 60 sec
(b) ρ = β/(1+λT)
= (.0075)/(1+(.1)(60))
= .0011 ΔK/K
4.10.7 Reactor power is being increased on a 50 second period.
(a) How long does it take to increase power from 2 kw to 1 Mw?
(b) What reactivity is assoicated with the 50 second period?
(c) What is Keff during the power increase?
Solution:
(a) P = P0et/T
t = T ln(P/P0)
= 50 ln(103/2)
= 311 sec
(b) T = (β-ρ)/λρ
ρ = β/(1+λT)
= .0075/(1+(.1)(50))
= .0013
(c) Keff = 1/(1-ρ)
= 1/(1-.0013)
= 1.0013
4.10.8 (a) If the power level of a reactor is increased exponentially from 20 kw to 40 kw in 40 seconds, what is the reactor period?
(b) What is the doubling time?
Solution:
(a) P = P0et/T
40 = 20 e 40/T
40/20 = e 40/T
2 = e40/T
T(.693) = 40
T = 58 sec
(b) DT = 40 seconds
4.10.9 A reactor is operating at 2 Mw (100% full power) and the reactor scram is set for 125% full power. What will be the peak power if a nuclear excursion creates a 100 millisecond period and the scram delay time is 0.1 seconds after 125% power is reached? (Assume no temperature or void effects and that the period scram is inoperative)
Solution:
P(t) = P(o)et/T
P(o) = 1.25(2 Mw) = 2.5 Mw
T = .1 sec
t = .1 sec assuming rods on bottom after this
delay
P(.1)= 2.5 e.1/.1
= 2.5 e
= 6.78 Mw
4.10.10 The reactor is critical with Keff = 1 at 1 kw. A rod is withdrawn to put the reactor on a positive period. Two doubling time measurements are taken:
2 kw - 4 kw = 25 sec 4 kw - 8 kw = 40 sec
(a) Why is the first measurement shorter?
(b) Which will give the most accurate rod worth?
(c) What is the period in each instance?
(d) Why are these measurements taken in the watt or
low kilowatt range instead of the MW range?
Solution:
(a) The first measurement was taken before the prompt jump had completely decayed away.
(b) The second measurement will give the most accurate rod worth.
(c) ln P/P0 = t/T
= ln 2
T = t/ln 2
t = 25 seconds T = 36.1 seconds
t = 40 seconds T = 57.7 seconds
(d) Period measurements must be done at low powers so that the effects of temperature are negligible. In the Mw regions, temperature feedback as negative reactivity would make a significant error in the period measurement.
4.10.11 What is the reactor period for a doubling time of sixty (60) seconds?
Solution:
P(60) = 2P0 2P0 = P0 et/T 2 = e60/T ln 2 = 60/T T = 60/ln 2 = 60/.693 = 86.6 sec
4.10.12 Briefly describe the effect of delayed neutrons on the following:
(a) Mean neutron lifetime;
(b) Reactor period;
(c) Neutron flux decay following a scram from full power.
Solution:
(a) Delayed neutrons increase the mean neutron lifetime from approximately l* = 1x10⁻⁴ seconds to ld = (1-β)l* + βτ = .0976 seconds provided reactivity is less than β.
(b) In a prompt reactor, T = l*/ρ, while in a delayed reactor, T = (β-ρ)/λρ = (β-ρ)τ/ρ.
For a reactivity addition less than β, the delayed period is considerably longer than the prompt period.
(c) Following the prompt drop, neutron level in the core is sustained by the decay of fission product precursors. The shortest lived precursors cause power to decrease fairly rapidly as they decay. Decay of the longest lived precursor, Br 87, limits the final rate at which power decreases to a -80 second period.
4.10.13 Why does the neutron flux increase rapidly and then settle into a stable period when positive reactivity is added to make the reactor supercritical?
Solution:
There is a prompt jump caused by immediate effects of prompt neutrons. A stable period follows which is determined by the amount of reactivity inserted and the delayed neutron generation time.
4.10.14 What is the source of heat in the core after shutdown?
Solution:
Decay of fission products.
4.10.15 (a) Illustrate by sketch how the neutron flux behaves during the first 15 seconds following a step increase in reactivity.
(b) Explain the reason for any change in the slope of the curve.
Solution:
(a) Figure 4.5
(b) Immediate jump is due to prompt neutrons. This takes ≈ 30 msec. The subsequent increase is caused by neutron multiplication as a result of the positive reactivity addition.
4.10.16 (a) If the power level of the reactor is 10 kw at time t0 and 150 kw 40 seconds later, what is the period of the reactor?
(b) What is the excess reactivity?
Solution:
(a) P0 = 10 kw
P(40) = 150 kw
t = 40 sec
P(40) = P0et/T
P(40)/P0 = et/T
ln(P(40)/P0) = t/T
T = t/ln(P(40)/P0) = 40/ln(150/10) = 40/ln(15)
= 40/2.7
T = 14.8 sec
(b) T = (β-ρ)/λρ
ρ = β/(1+λT)
= .0075/(1+(.1)(14.8))
= .0030 ΔK/K
4.10.17 Describe reactor response following a negative reactivity addition from an exactly critical reactor.
4.10.18 Calculate reactor period from a recorder trace.
4.10.19 Explain the term λ in the period equation.
4.10.20 Explain the effect of rod motion on reactor period.
4.10.21 The reactor has a positive period of 60 seconds. How long does it take to go from 10 kw to 7 Mw assuming there are no reactivity coefficient effects. Show all work.
4.10.23 After 6 months of full power operation a problem develops such that the reactor scrams and is kept in a shutdown condition for the next 30 days. Explain what the major determining factor of shutdown power level is after:
(a) 5 seconds;
(b) 10 seconds;
(c) 30 days.
4.10.24 The statement is made that at the same constant period rate, it takes the same time to change reactor power from 1% to 5% as it does from 10% to 50%. Do you agree? Explain.
4.10.25 (a) Define prompt critical.
(b) If the reactor is prompt critical, what effect will the delayed neutrons have on the reactor period?
(c) Is prompt critical a desirable or undesirable condition? Explain.
4.10.26 A reactor operator pulls control rods and places the reactor on a 30 second period from an initial power level of 100 watts.
(a) What will the power level be after 1 minute?
(b) How long will it take (in seconds) to reach a power level of 100 kw?
4.10.27 Define and explain the significance of decay heat.
4.10.28 The reactor is operating at a stable low power level (5 Mwt) and a central rod is withdrawn to give a stable 100 sec period. Sketch a trace of the period and power for the next 3 minutes and identify changes in the trace.
4.10.29 How long will it take to increase level from 10kw to 4 Mw on a 75 sec period? Show your work.
4.10.30 Reactor power is increasing on a 90 second period. If the initial power was 50 Mwt, what will be the reactor power in 3 minutes? (Ignore temperature and void effects)
4.10.31 How long would it take to increase power from 100 watts to 500 kw on a 30 second period?
4.10.32 On a given instrument range, the power is increased from 20 to 80 watts in 180 seconds.
(a) What is the period?
(b) How much reactivity was inserted to produce this period?
(c) What would reactor power be after an additional 6 minutes?
4.10.33 Assume you are watching the wide range Log N channel during a trip from full power.
(a) Approximately how far (in terms of decades or % power) will the indication drop initially? Explain.
(b) Briefly explain the behavior of the indication over the next 4-5 minutes.
4.10.34 If Keff = .95:
(a) Do you add or subtract reactivity from the core to make it critical;
(b) How much reactivity do you add or subtract to be critical?
4.10.35 1% excess reactivity is added to a critical reactor producing a short stable positive period. -1% insertion causes a longer stable negative period.
(a) Calculate the positive period;
(b) Calculate the negative period;
(c) Why are they not the same values?
4.10.36 Two minutes after a scram from power (several full power days history), a large number of neutrons are still present in the core. Discuss the source(s) of all these neutrons.
4.10.37 With β = .007, λ = .100 sec-1 and a stable period equal to 37 seconds, what is the reactivity? Show calculations.
4.10.38 A reactor is at 1000 Mwt (100% full power) and the scram is set for 150% full power. What will be the peak power if a nuclear excursion creates a 0.1 second period and the scram delay time is 0.1 second after 150% power is reached? (Assume no temperature or void effects).
Subcritical multiplication is the increase in neutron population, total number of neutrons in the reactor core, by positive reactivity additions, addition of fuel elements or withdrawal of control rods, while the reactor is subcritical.
Define subcritical multiplication.
Subcritical multiplication is the increase in neutron population by positive reactivity additions while the reactor is subcritical.
After studying the lesson material and working exercise problems, the student should be able to:
1. Define subcritical multiplication.
2. Describe primary and secondary neutron sources, critical loading experiment, and addition of a neutron source to a critical reactor.
3. Plot inverse multiplication versus Keff or fuel mass and explain the possible curve shapes.
4. Solve problems involving subcritical count rates, core reactivity, and rod worth.
5. Explain how doubling count rate during a startup can be used by the operator to predict criticality.
Prior to reactor startup, it is necessary to have a supply of neutrons in the core to provide positive, accurate power level and period instrument indications in the source range and to control the neutron multiplication rate as positive reactivity is added to the core.
Deuterium (D2O) occurs naturally in light water, 0.016%, and is produced in small amounts during reactor operation by absorption of neutrons into the hydrogen nuclei of the coolant. A relatively high fission product gamma is needed for the heavy water neutron production reaction. There are about 15 fission products that emit a gamma of sufficient energy, The primary fission products are lanthanum-140, barium-140, and rhodium-106. Rhodium-106 is the daughter of ruthenium-106. Because of the need for fission product gammas to carry out the reaction, this neutron source is significant only after considerable core operation.
Two neutron sources are present, but produce relatively insignificant quantities of neutrons. Uranium and plutonium undergo spontaneous fission that collectively produces about 100 neutrons/hr/g fuel. Oxygen-18, present in the uranium oxide fuel, reacts with an α particle from the radioactive decay of U235 or U238 to produce neutrons. Oxygen-18 makes up about 0.204% of the oxygen in uranium oxide fuel. The neutron producing reaction is:
2α4 + 8O18 --> 10Ne21 + 0n1
Within fuel, neutrons are produced from Cm242 and Cm244 by:
1. Spontaneous fission of curium nuclei. For highly exposed fuel, the neutron source concentration is provided predominantly by spontaneous fission of Cm244. For lower exposure fuel, <20,000 Mwd/ton, the neutron source concentration is provided predominantly by spontaneous fission of Cm242.
2. Alpha-neutron reactions, primarily with O18 in the uranium oxide fuel, except with the alpha coming from the decay of curium.
Neutron sources are of two types: (1) a primary source, which is active for initial reactor startup and startup early in the life of the first core; and (2) a secondary source, used for later startup of the reactor and activated during the operation of the reactor.
In a power reactor, the primary and secondary sources are rod like in structure, similar to a PWR control rod. Both types are clad in stainless steel. In a research reactor, sources are generally more compact and cylindrical. The specific core location of sources is determined during final design of the core to assure adequate neutron flux at the source range detectors at all times.
Primary Sources
a. Neutron Emitter (Spontaneous Fission)
98Cf252 --> Fission + 0n1 (3% of decays)
b. Alpha Emitter (α,Be)
98Cf252 --> 96Cm248 + 2α4 (97% of decays)
60.5d
96Cm244 --> 94Pu240 + 2α4
18y 2α4 + 4Be9 --> 6C12 + 0n1
Secondary Sources
a. Alpha Emitter (α,Be)
84Po210 --> 82Pb206 + 2α4
138d 2α4 + 4Be9 --> 6C12 + 0n1
b. Gamma Emitter (γ,Be)
51Sb124 --> -1β0 + 52Te124 + 0γ0 (1.69MeV)
60.2d 0γ0 + 4Be9 --> 22α4 + 0n1
c. Photoneutron (γ,1H2)
0γ0 + 1H2 --> 1H1 + 0n1
The (γ,Be) reaction requires a minimum gamma energy of 1.67 MeV and the (γ,1H2) reaction requires a minimum 2.23 MeV gamma. Photoneutrons provide a large neutron flux in reactors that utilize heavy water. Even in light water reactors sufficient heavy water molecules are present to provide a photoneutron startup source as the result of fission product gamma-heavy water interactions.
Two things to be noted about an antimony-beryllium source are that it is built up at power by the nuetron-antimony-123 reaction and it has a relatively short half life. Initial fueling must be completed before the neutron source decays or it will have to be removed from the reactor, irradiated at a test facility, and returned to the core before startup can take place.
Neutron production from a californium or similar source is typically between 1x10⁴ and 2x10⁷ neutrons/sec.
After a reactor has been operational for an entire cycle, the startup sources are no longer necessary and they are removed from the core. There is a sufficient natural neutron population to maintain adequate count rates on source range monitoring instruments and to permit startup.
Define and provide examples of primary and secondary neutron sources.
Primary Neutron Source
A radioactive source used for initial startup.
98Cf252 --> Fission + 0n1
--> 96Cm248 + 2α4
60.5d
2α4 + 4Be9 --> 6C12 + 0n1
Secondary Neutron Source
51Sb124 --> -1β0 + 52Te124 + 0γ0 (1.69 MeV)
60.2d
0γ0 + 4Be9 --> 2 2α4 + 0n1
What is the primary reason for having a neutron source in an operating reactor?
Instrument response checks.
Is a neutron source necessary to promote subcritical multiplication during the startup of an operating reactor?
No. Light water has sufficient heavy water contamination to provide adequate photoneutrons for startup.
0γ0 + 1H2 --> 1H1 + 0n1
Initially, suppose that a neutron source similar to one of those described above produces S n/cm3/generation in the core. A generation is chosen as a convenient time interval because the subcritical multiplication process is tied to the overall reactor multiplication process. Each generation, S n/cm3 are contributed to the overall neutron population by the source in addition to the neutrons already present.
In a subcritical reactor, the multiplication factor, K, between generations is less than one. As a first example, assume K=0.5. Subcritical multiplication for K=0.5 is illustrated in Table 5.1. In the first generation, S contributes 1000 neutrons, an arbitrarily selected value. The core neutron population, C, is 1000. In the second generation, the first generation neutrons are multiplied by K=0.5 and S produces another 1000 neutrons. The core neutron population increases to 1500. In the third generation, first generation neutrons are again multiplied by K=0.5, second generation neutrons are also multiplied by K=0.5, and S produces another 1000 neutrons. The core neutron population increases to 1750.
Subcritical multiplication increases from generation to generation and is the sum of each succeeding column in Table 5.1. Each generation, S produces 1000 neutrons. In each succeeding generation, that value is multiplied by K. After a large number of generations, the column summation in Table 5.1 can be written mathematically as:
C = S + KS +K2S + K3S + K4S .... + KNS (5.1) = S(1 + K + K2 +K3 +K4 .... + KN) (5.2)
The summation of powers of K is a series that can simply be written as 1/1-K. Thus,
C = S/1-K (5.3)
Equation (5.3) determines the long term, steady state, increased neutron population that results in the core when an initial source is multiplied by a value of K<1. In the Table 5.1 example,
C = 1000/1-0.5 = 2000
Table 5.1 Subcritical Multiplication
Keff = 0.5
Source Strength, S = 1000
Reactor Neutron Generation
Gen. 1 2 3 4 5 6 7 8 9 10.....N
t(sec) .1 .2 .3 .4 .5 .6 .7 .8 .9 1.....∞
---- ---- ---- ---- ---- ---- ---- ---- ---- ---- ------
1 S KS K2S K3S K4S K5S K6S K7S K8S K9S...KN-1S
1000 500 250 125 63 31 16 8 4 2
2 S KS K2S K3S K4S K5S K6S K7S K8S...KN-2S
1000 500 250 125 63 31 16 8 4
S 3 S KS K2S K3S K4S K5S K6S K7S...KN-3S
o 1000 500 250 125 63 31 16 8
u
r 4 S KS K2S K3S K4S K5S K6S...KN-4S
c 1000 500 250 125 63 31 16
e
5 S KS K2S K3S K4S K5S...KN-5S
M 1000 500 250 125 63 31
u
l 6 S KS K2S K3S K4S...KN-6S
t 1000 500 250 125 63
i
p 7 S KS K2S K3S...KN-7S
l 1000 500 250 125
i
c 8 S KS K2S...KN-8S
a 1000 500 250
t
i 9 S KS...KN-9S
o 1000 500
n
10 S...KN-10S
. 1000 .
. .
. .
N S
---- ---- ---- ---- ---- ---- ---- ---- ---- ---- ------
C 1000 1500 1750 1875 1938 1969 1985 1993 1997 1999 S/(1-K)
A second example is provided in Table 5.2. Again, S = 1000, but in this example, K=0.9. The multiplication process is identical to the first example except that the ultimate neutron population is
C = 1000/1-.9 = 10,000
which is five times greater than the number resulting from K=0.5. It can be seen from Table 5.1 that at the end of ten generations, C has very nearly reached its increased steady state value of 2000. Table 5.2 shows that after ten generations, C is still far away from its ultimate steady value of 10,000.
The conclusions that can be drawn from these examples are:
1. A subcritical multiplication factor, K, closer to 1 produces a larger subcritical neutron population, C.
2. A larger multiplication factor, K, results in a longer time to reach the steady state value of subcritical neutron population, C.
The reactor operator observes neutron population as source range detector count rate. As larger and larger subcritical values of K are reached, the operator must wait longer times for the subcritical count rate to stabilize. If the reactor is almost critical, the time can be longer than ten minutes.
The two extremes of subcritical multiplication, K=0 and K=1, are illustrated in Tables 5.3 and 5.4. When K=0, no multiplication takes place and C remains at the source level, 1000. When K=1, the reactor is just critical. Neutron population increases by 1000 with each generation and continues to increase linearly without limit.
The reactor operator determines criticality by observing that the fission chamber count rate does not fall off and stabilize, but continues to increase with time. Technically, the reactor is slightly supercritical at this point, but it is generally accepted as the best indication of criticality available.
Figure 5.1 is a plot of subcritical multiplication for 0≤K<1. The plot confirms conclusions (1) and (2) drawn earlier.
Table 5.2 Subcritical Multiplication
Keff = 0.9
Source Strength, S = 1000
Reactor Neutron Generation
Gen. 1 2 3 4 5 6 7 8 9 10.....N
t(sec) .1 .2 .3 .4 .5 .6 .7 .8 .9 1.....∞
---- ---- ---- ---- ---- ---- ---- ---- ---- ---- ------
1 S KS K2S K3S K4S K5S K6S K7S K8S K9S...KN-1S
1000 900 810 729 656 591 531 478 430 387
2 S KS K2S K3S K4S K5S K6S K7S K8S...KN-2S
1000 900 810 729 656 591 531 478 430
S 3 S KS K2S K3S K4S K5S K6S K7S...KN-3S
o 1000 900 810 729 656 591 531 478
u
r 4 S KS K2S K3S K4S K5S K6S...KN-4S
c 1000 900 810 729 656 591 531
e
5 S KS K2S K3S K4S K5S...KN-5S
M 1000 900 810 729 656 591
u
l 6 S KS K2S K3S K4S...KN-6S
t 1000 900 810 729 656
i
p 7 S KS K2S K3S...KN-7S
l 1000 900 810 729
i
c 8 S KS K2S...KN-8S
a 1000 900 810
t
i 9 S KS...KN-9S
o 1000 900
n
10 S...KN-10S
. 1000 .
. .
. .
N S
---- ---- ---- ---- ---- ---- ---- ---- ---- ---- ------
C 1000 1900 2710 3439 4095 4686 5217 5695 6125 6512 S/(1-K)
Table 5.3 Subcritical Multiplication
Keff = 0.0
Source Strength, S = 1000
Reactor Neutron Generation
Gen. 1 2 3 4 5 6 7 8 9 10.....N
t(sec) .1 .2 .3 .4 .5 .6 .7 .8 .9 1.....∞
---- ---- ---- ---- ---- ---- ---- ---- ---- ---- ------
1 S KS K2S K3S K4S K5S K6S K7S K8S K9S...KN-1S
1000 0 0 0 0 0 0 0 0 0
2 S KS K2S K3S K4S K5S K6S K7S K8S...KN-2S
1000 0 0 0 0 0 0 0 0
S 3 S KS K2S K3S K4S K5S K6S K7S...KN-3S
o 1000 0 0 0 0 0 0 0
u
r 4 S KS K2S K3S K4S K5S K6S...KN-4S
c 1000 0 0 0 0 0 0
e
5 S KS K2S K3S K4S K5S...KN-5S
M 1000 0 0 0 0 0
u
l 6 S KS K2S K3S K4S...KN-6S
t 1000 0 0 0 0
i
p 7 S KS K2S K3S...KN-7S
l 1000 0 0 0
i
c 8 S KS K2S...KN-8S
a 1000 0 0
t
i 9 S KS...KN-9S
o 1000 0
n
10 S...KN-10S
. 1000 .
. .
. .
N S
---- ---- ---- ---- ---- ---- ---- ---- ---- ---- ------
C 1000 1000 1000 1000 1000 1000 1000 1000 1000 1000 S/(1-K)
Table 5.4 Subcritical Multiplication
Keff = 1.0
Source Strength, S = 1000
Reactor Neutron Generation
Gen. 1 2 3 4 5 6 7 8 9 10.....N
t(sec) .1 .2 .3 .4 .5 .6 .7 .8 .9 1.....∞
---- ---- ---- ---- ---- ---- ---- ---- ---- ---- ------
1 S KS K2S K3S K4S K5S K6S K7S K8S K9S...KN-1S
1000 1000 1000 1000 1000 1000 1000 1000 1000 1000
2 S KS K2S K3S K4S K5S K6S K7S K8S...KN-2S
1000 1000 1000 1000 1000 1000 1000 1000 1000
S 3 S KS K2S K3S K4S K5S K6S K7S...KN-3S
o 1000 1000 1000 1000 1000 1000 1000 1000
u
r 4 S KS K2S K3S K4S K5S K6S...KN-4S
c 1000 1000 1000 1000 1000 1000 1000
e
5 S KS K2S K3S K4S K5S...KN-5S
M 1000 1000 1000 1000 1000 1000
u
l 6 S KS K2S K3S K4S...KN-6S
t 1000 1000 1000 1000 1000
i
p 7 S KS K2S K3S...KN-7S
l 1000 1000 1000 1000
i
c 8 S KS K2S...KN-8S
a 1000 1000 1000
t
i 9 S KS...KN-9S
o 1000 1000
n
10 S...KN-10S
. 1000 .
. .
. .
N S
---- ---- ---- ---- ---- ---- ---- ---- ---- ---- ------
C 1000 2000 3000 4000 5000 6000 7000 8000 9000 10000 S/(1-K)
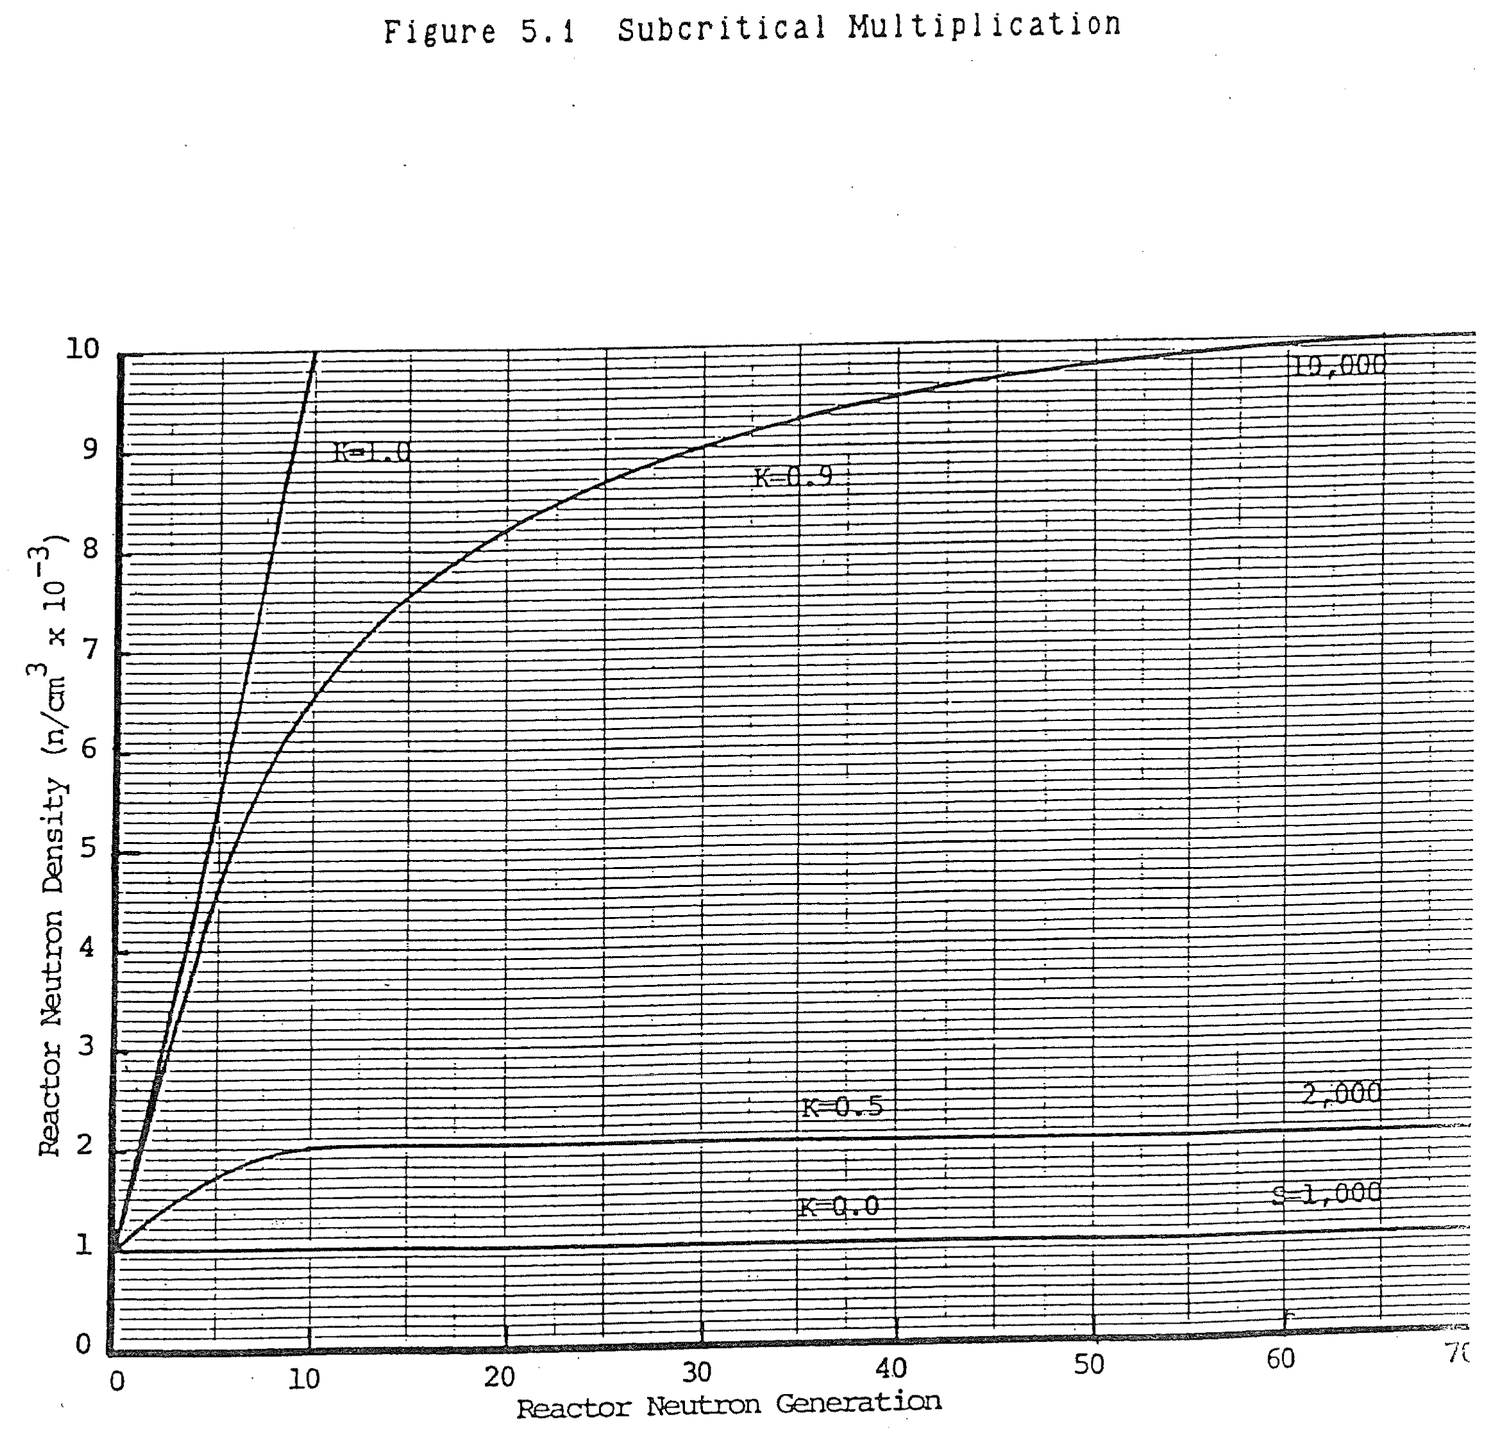
In theory and in practice, it is frequently useful to manipulate equation (5.3). Equation (5.3) can be represented approximately in terms of reactivity, ρ.
ρ = K-1/K (5.4) ≈ K-1 (5.5) C ≈ S/-ρ (5.6)
Demonstrate that the series (1+K+K2+ ......+KN) = 1/(1-K).
1+K+K2+K3....
--------------
1-K √1
1-K
---
K
K-K2
----
K2
K2-K3
------
K3
K3-K4
------
During subcritical multiplication, as K approaches one, neutron population multiplies to a higher level and takes longer to stabilize. Why?
Subcritical multiplication is represented by the series,
C = S(1+K+K2 + ...... KN) = S/(1-K)
As K approaches one, more and more terms in the infinite series remain significant. For example, when K = 0.5, the tenth term is K10 = (0.5)10 = 0.00098. When K = 0.9, the tenth term is K10 = (0.9)10 = 0.349. Thus, since each term represents a generation (0.1 sec), more time is required to make the final terms approach zero as K approaches one.
How many generations must pass before a subcritically multiplying reactor reaches its final subcritical level?
Assume that the final subcritical level has been reached when a given term in the series, C = S(1+K+K2+ ..... KN), is equal to or less than one count.
SKN = 1 KN = 1/S eNlnK = eln(1/S) N lnK = ln(1/S) N = ln(1/S)/lnK
For example, if S = 1,000 and K = 0.5,
N = ln(1/1,000)/ln0.5 = 9.97 = 10 generations at 0.1 seconds/generation
For S = 1,000 and K = 0.9
N = ln(1/1,000)/ln0.9 = 65.56 = 66 generations = 6.6 seconds
For S = 1,000 and K = 0.999
N = ln(1/1,000)/ln0.999 = 6,904.3 = 6,905 generations = 11.5 minutes
Subcritical multiplication techniques are used to measure the approach to criticality by uranium fuel addition, changes in core geometry, and control rod withdrawal. The basic concept is to measure the effect on neutron multiplication by positive reactivity additions.
Suppose that a reactor is in a stable condition with neutron source, S, having produced a neutron population, C, measured as C0 counts on the fission chamber. Now, suppose positive reactivity is added and the neutron population multiplies to some new value, C1, counts.
C0 = S/1-Ko (5.7) C1 = S/1-K1 (5.8)
The multiplication, M, between these two states is:
M = C1/C0 (5.9) = 1-Ko/1-K1 (5.10)
As the reactor approaches criticality, K1 approaches 1 and M becomes infinite. That is, the neutron population increases without limit.
A more useful grahpic concept is inverse multiplication, 1/M.
1/M = C0/C1 (5.11)
= 1-K1/1-Ko
The relationship between K1, ρ, M, 1/M, and criticality is shown in Table 5.5. From equation (5.11), it can be seen that the relationship between 1/M and K1 is linear; a straight line with a negative slope.
The reactor's approach to criticality can be seen clearly from a plot of 1/M versus K as illustrated in Figure 5.2. An initial set of counts, C0, is taken. The initial subcritical value of 1/M is:
1/M = C0/C0
= 1
Table 5.5 Variation in Reactivity, Multiplication, and
Inverse Multiplication with Keff.
-----------------------------------------------------------------------------
| Parameter | Value |
|-----------|---------------------------------------------------------------|
| K | 0 | 0.1 | 0.5 | 0.9 | 1.0 |
|-----------|------------|------------|------------|------------|-----------|
| ρ | -∞ | -9.00 | -1.00 | -0.11 | 0 |
|-----------|------------|------------|------------|------------|-----------|
| M | 1 | 1.11 | 2 | 10 | ∞ |
|-----------|------------|------------|------------|------------|-----------|
| 1/M | 1 | 0.9 | 0.5 | 0.1 | 0 |
|-----------|---------------------------------------------------------------|
| | Subcritical -------------------------------------> Critical |
| |---------------------------------------------------------------|
| | Fuel Addition -----------------------------------> |
| |---------------------------------------------------------------|
| | Rod Withdrawal ----------------------------------> |
-----------------------------------------------------------------------------
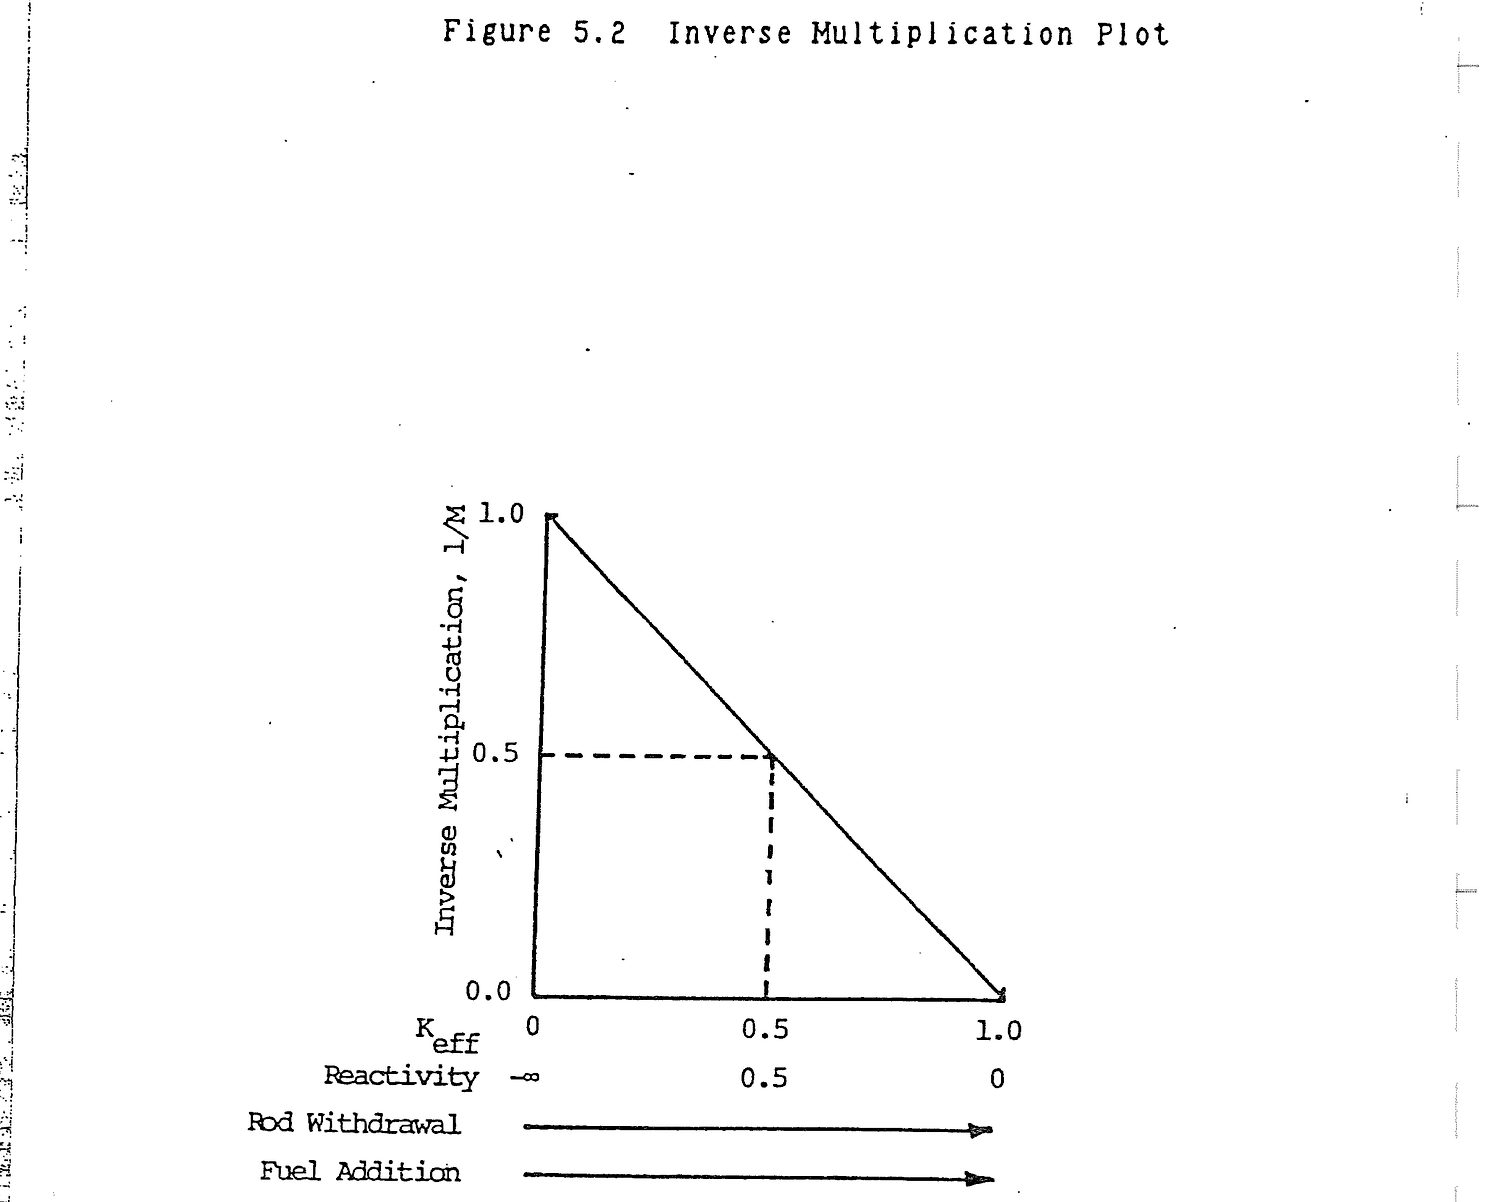
As positive reactivity is added by fuel addition or rod withdrawal, the count rate increases. 1/M decreases toward zero. K increases toward 1. Table 5.5 shows that 1/M is a straight line function of K. Thus, the ideal 1/M plot is a straight line between the value (1/M=1, K=0) and (1/M=0, K=1).
Inspection of Figure 5.2 shows that when 1/M=0.5, Keff is half way between its initial value and one. This observation is useful to the reactor operator during reactor startup. Prior to startup, a fission chamber count rate is taken. Rods are withdrawn to the position where count rate doubles. At this point, 1/M=0.5 and the reactor is half way to criticality. The same increase in Keff and approximately the same additional rod reactivity will make the reactor critical.
What is the relationship between inverse multiplication, 1/M, and K?
Co = S/1-Ko
CN = S/1-KN where N is an arbitrary set of counts.
1/M = Co/CN
= (S/1-Ko)/(S/1-KN)
= 1-KN/1-Ko
The term, 1-Ko, is a constant common to any neutron multiplication.
1/M = Constant(1-KN)
The relationship between 1/M and KN is linear, that is, a plot of 1/M verses K is a straight line with a negative slope.
How is an inverse multiplication plot (1/M versus K) used to predict criticality?
A plot of inverse multiplication (1/M = Co/Cn = constant (1-KN)) versus K is a straight line with a negative slope. If two points on the line are known, all points are known. The line intersects the K axis at 1/M = 0 which means K must equal one and the reactor is critical. By taking only two sets of detector counts while loading fuel, the critical load can be predicted.
In the critical loading experiment, fuel elements are added around a neutron source. As fuel is added, K increases from zero and multiplication of neutrons occurs in the mass being assembled. Fission chamber counts increase as successive fuel elements are added. Inverse multiplication, 1/M, decreases toward zero. At the point, 1/M=0, the reactor is critical.
The technique can be used to predict criticality. After each fuel element addition, 1/M is calculated and plotted as shown in Figure 5.3. A line is drawn from the initial value of 1/M=1 through the calculated 1/M value until it intersects the horizontal axis. The extrapolated fuel mass, the axis intersect, is interpreted as the mass of fuel necessary for the reactor to become critical. After the extrapolation, the decision can be made to add more fuel. As fuel is added, the last two 1/M data points are extrapolated to the horizontal axis to predict criticality.
Problems arise when improper fuel loading sequences are utilized or the detector-source location is improper.
The fuel loading sequence shown in Figure 5.4 produces the 1/M plot shown. In this case, the predicted critical mass is always conservative, that is, the predicted mass is less than the actual critical mass. This occurs because the loading starts at a point near the detector and subsequent loadings get farther away. Even though the mass of fuel in each load is the same, the first element is relatively more effective in increasing neutron count rates near the detector than subsequent additions.
The same fuel loading sequence is shown in Figure 5.5, but the detector is located so that loading starts away from the detector and proceeds toward it. The resultant 1/M plot is convex outward. The loading sequence is dangerous because the estimated critical mass is always greater than the actual critical mass.
A loading sequence that can also cause seriously inaccurate critical mass prediction is shown in Figure 5.6. Fuel is loaded far enough away from the primary core mass so that subcritical multiplication of the core mass is not affected until the last element is added. The final coupling of the added elements to the primary mass produces criticality. The 1/M plot gives no information until criticality has been reached.
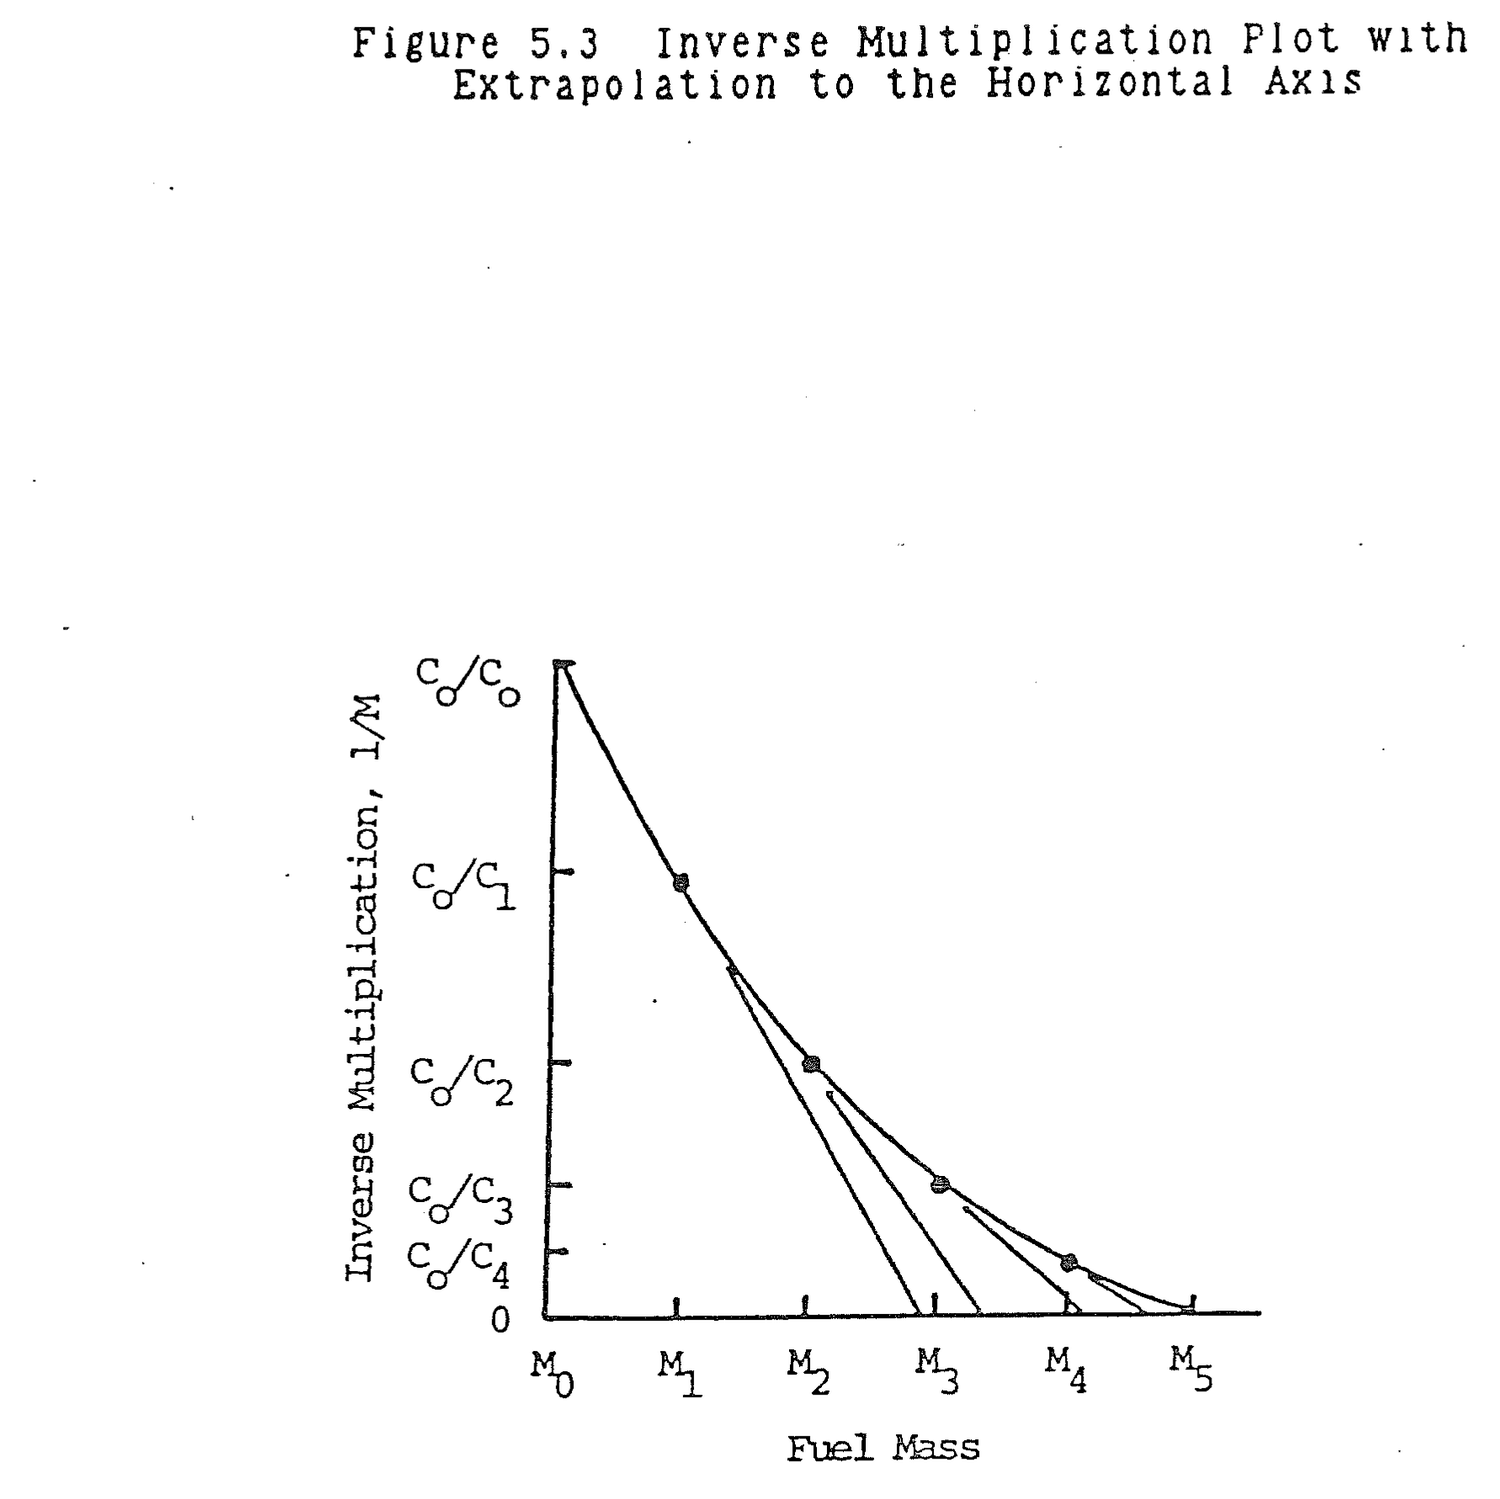
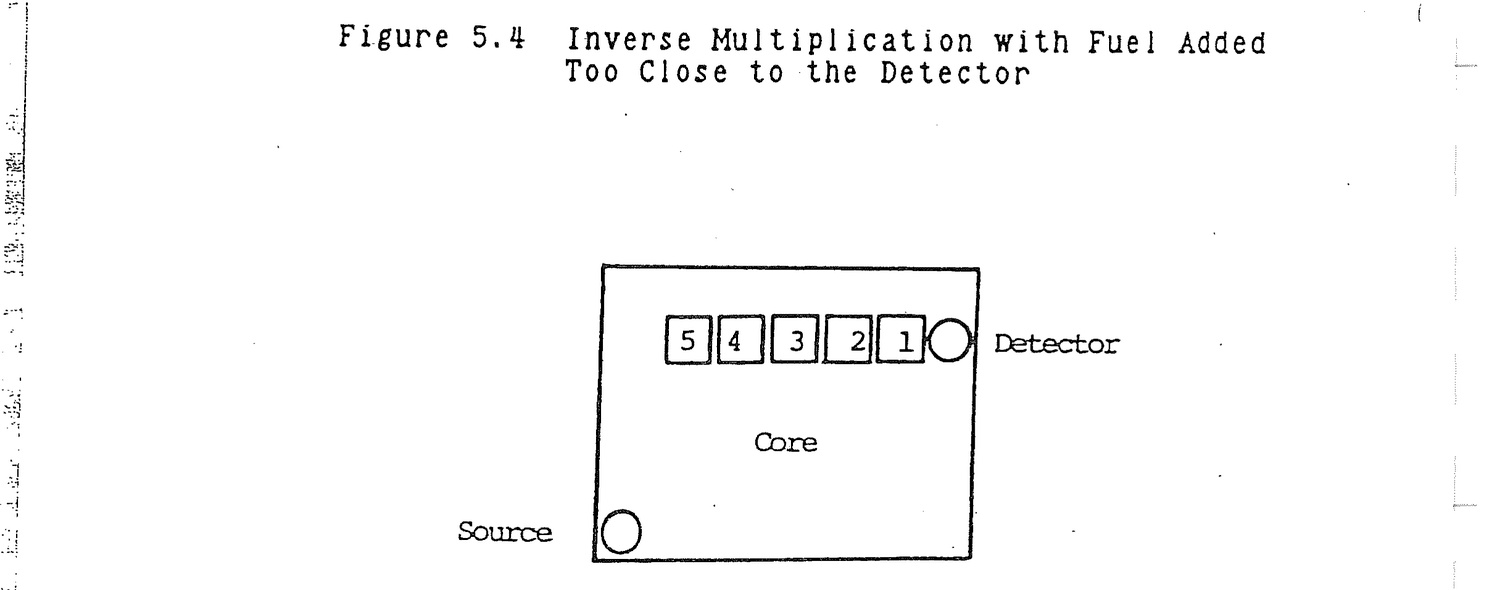
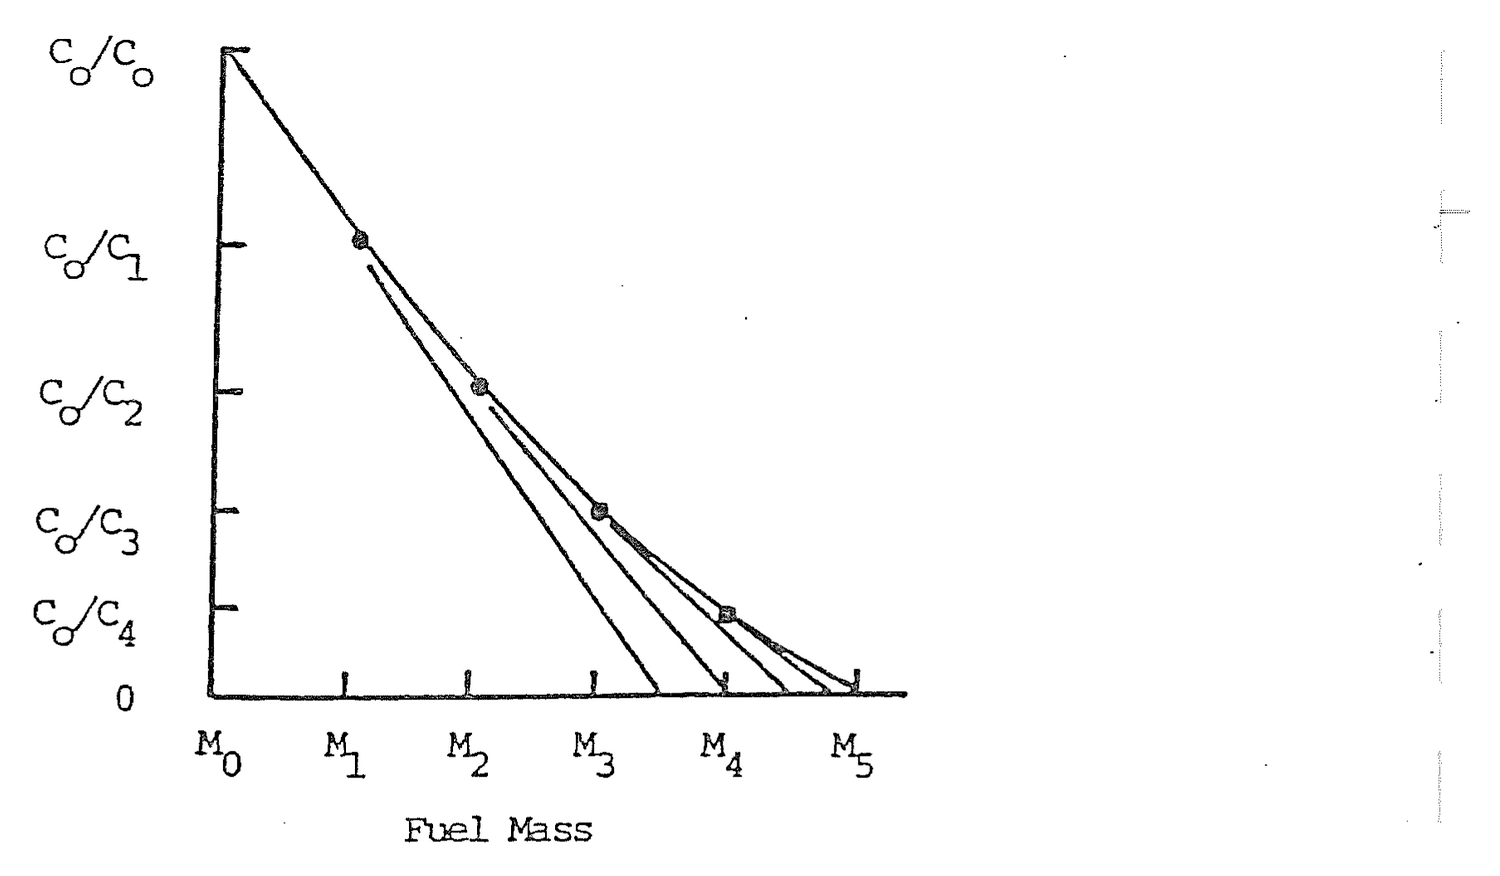
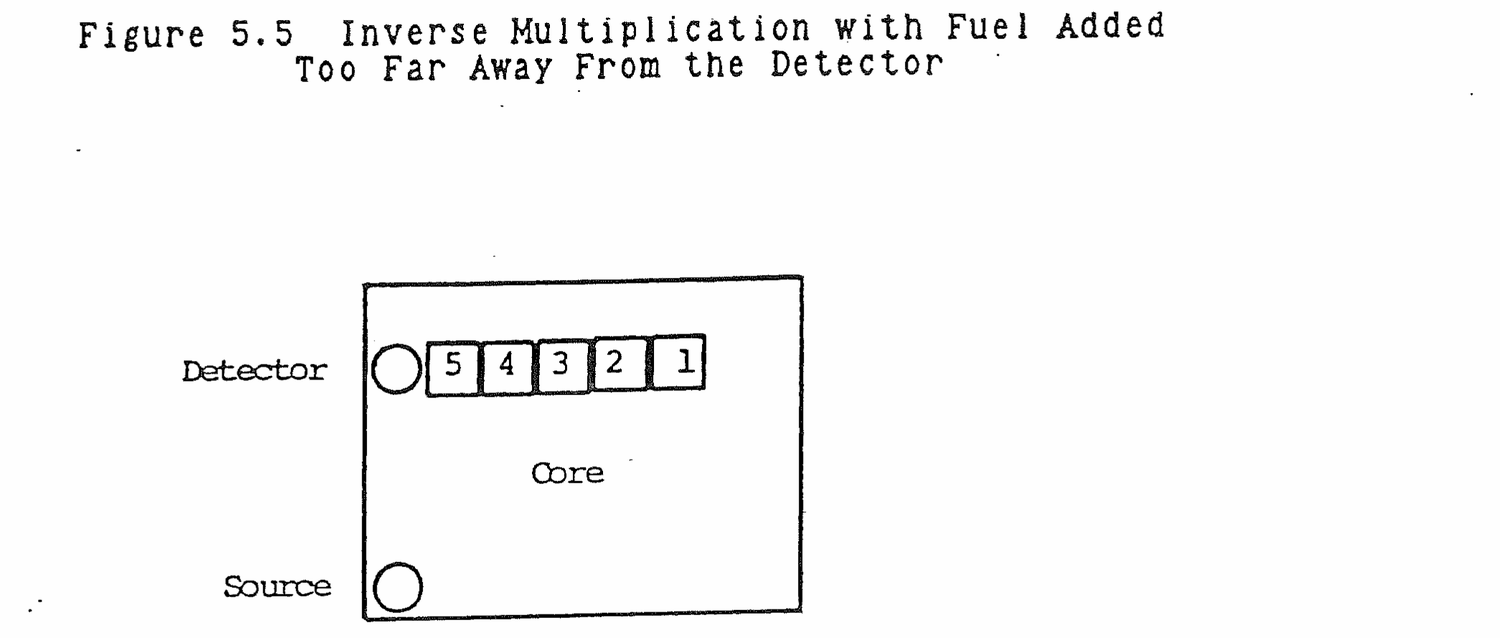

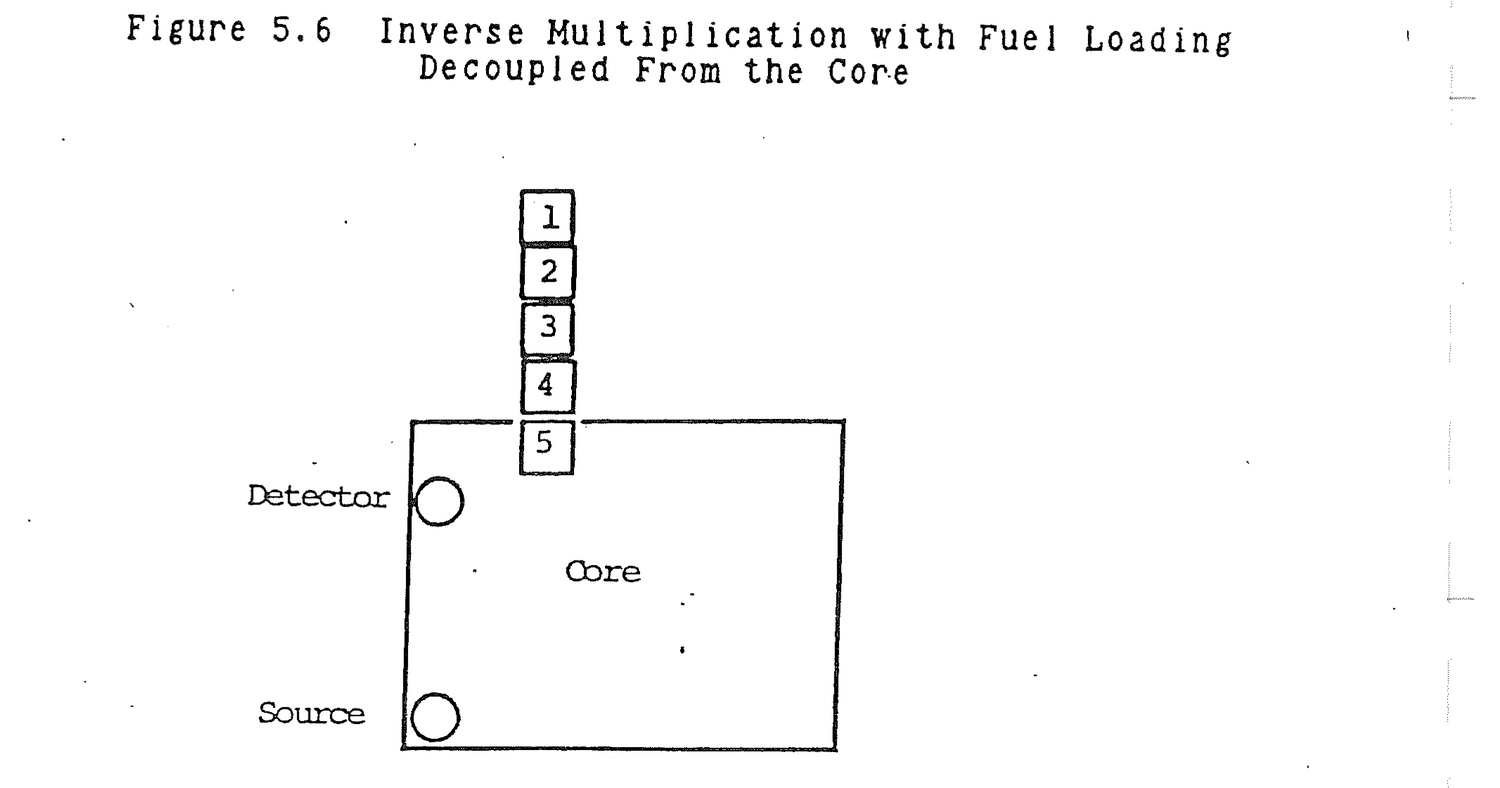

Difficulty can result from poor detector-source placement. For example, if the detector and source are too close, source neutrons will mask the effects of the fuel loadings. Best results are attained if fuel is loaded between the source and the detector. The detector then sees multiplication of source neutrons by the fuel.
During a critical loading experiment, the output of two detectors produce contradictory results. The inverse multiplication plot for detector 1 slopes downward while the plot for detector 2 balloons outward. Why are the two not consistent and why is neither a straight line?
Fuel is being loaded too close to detector 1. The count rate is greater than for the reactor as a whole. The value of inverse multiplication, 1/M [illegible] Co/CN, drops below the straight line value of a perfect loading. Fuel is being loaded far from detector 2. The count rate is below the reactor average. Inverse multiplication is greater than the straight line value and the curve balloons outward.
Keff = 0.8 in a subcritical reactor. Keff is increased until subcritical count rate is doubled.
(a) What is the new value of Keff?
1/M = Co/C1
= Co/2Co
= 0.5
= 1-K1/1-Ko
1-K1 = 0.5(1-Ko)
K1 = 1-0.5(1-0.8)
= 0.9
(b) What will be the effect of the same additional increase in Keff?
K1-Ko = 0.9-0.8
= 0.1
K2 = K1+0.1
= 0.9+0.1
= 1.0
The reactor is critical.
Keff = 0.8 in a subcritical reactor. Positive reactivity is added until subcritical count rate is doubled.
(a) What reactivity addition caused the count rate to double?
ρo = Ko-1/Ko
= 0.8-1/0.8
= -.250 delta K/K
ρ1 = K1-1/K1
= 0.9 - 1/0.9
= -.111 delta K/K
Δρ = ρ1 - ρo
= -.111 - (-.250)
= .139 ΔK/K
(b) What will be the effect of the same additional increase in reactivity.
ρ2 = ρ1 + Δρ
= -.111 + .139
= .028
K2 = 1/1-ρ2
= 1/1-.028
= 1.029
The reactor is supercritical.
Neutron source refers to any material which emits neutrons. The source is used in the reactor for initial startup and for a background level for startup instrumentation. The neutrons produced by the source initiate the fission reaction.
If the reactor is almost critical, the source may provide enough neutrons to make the reactor appear critical. This condition is termed source critical. If a reactor is just critical and contains no source, it will maintain the same neutron density over a long period of time. If a source is added, the reactor becomes supercritical and the neutron density will rise at a constant rate as indicated in Figure 5.7. The increase for each generation is constant and is equal to that number of neutrons which is contributed by the source in one generation. When the source makes a substantial contribution to the total flux, for example, at low neutron levels, its presence cannot be disregarded. With the neutron levels commonly encountered in power operation the contribution of the source is insignificant when compared to that of fission and can be disregarded.
In a supercritical reactor, the neutron density increases exponentially. If a source is added to this supercritical reactor, the neutron density still increases exponentially, but at a faster rate. As in the case of the critical reactor, the contribution of the source must be considered when operating at low neutron levels. At the higher neutron levels where the source furnishes a minute fraction of the total, it becomes insignificant.
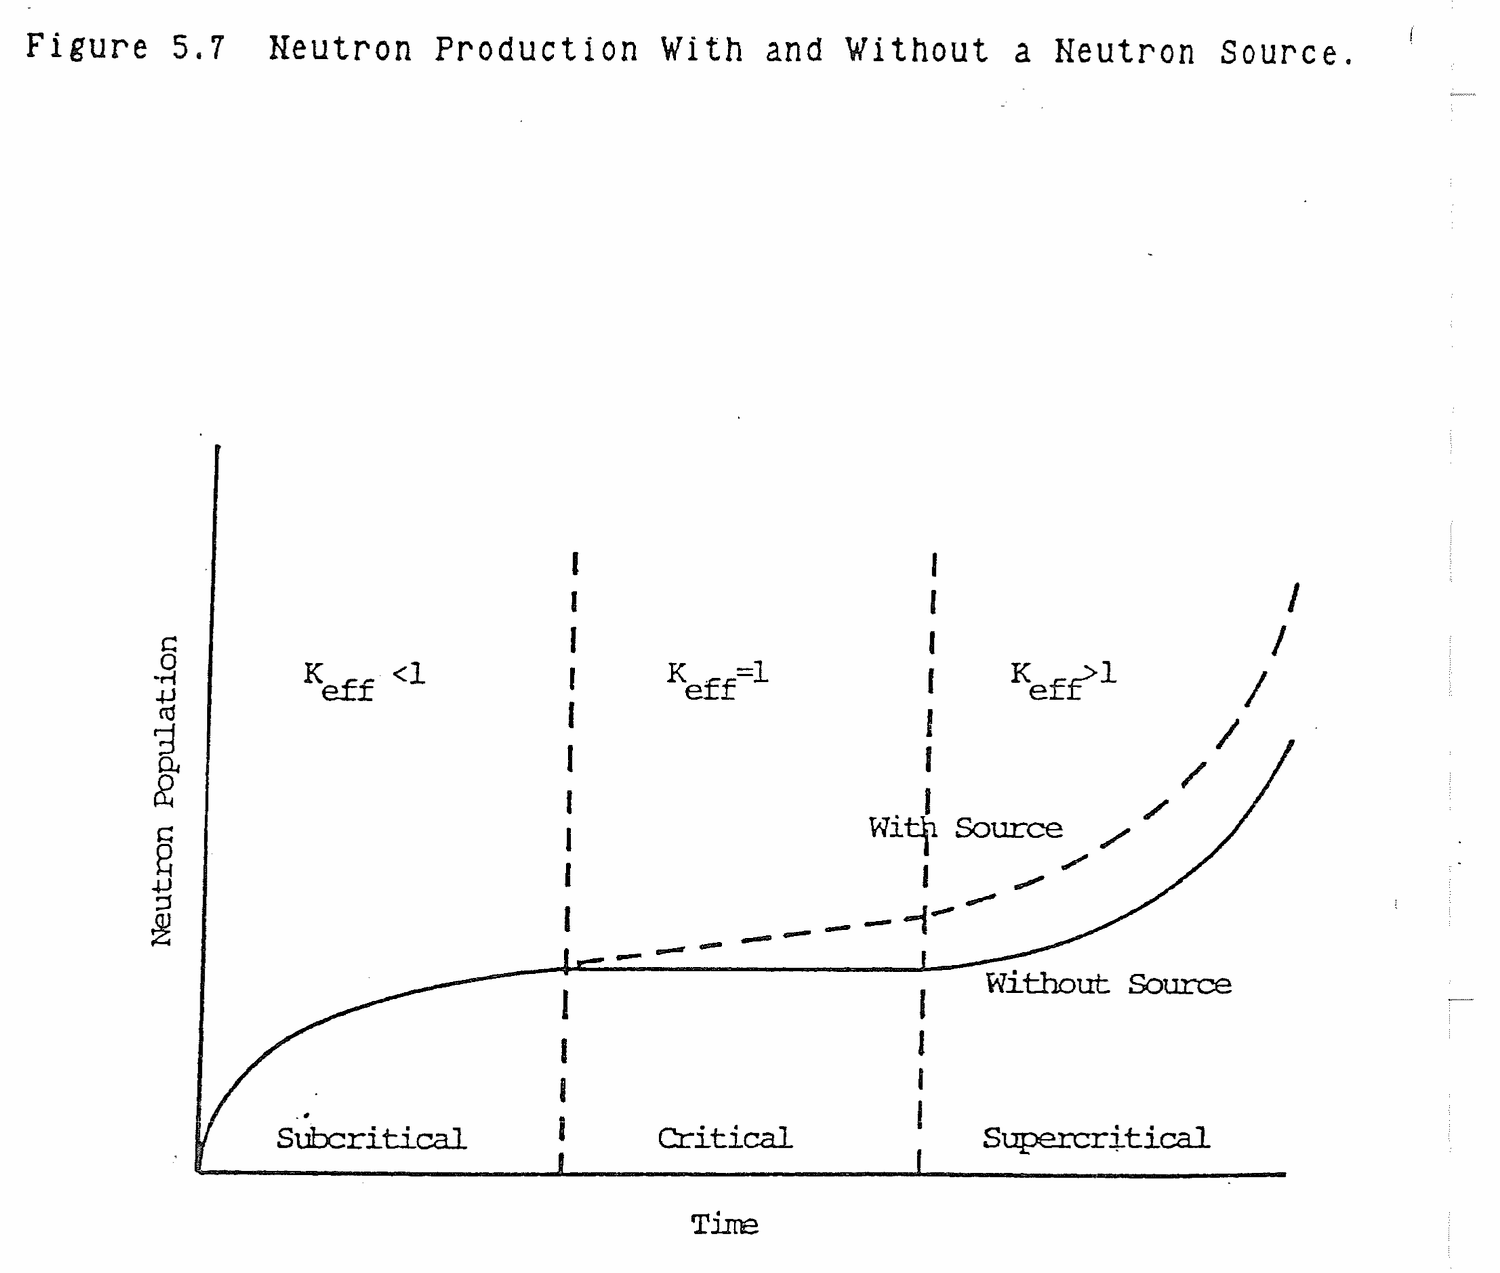
What happens to reactor power when a neutron source is added to a critical reactor?
The reactor is supercritical because of the source while K = 1 in the reactor due to fuel alone. This condition is the same as illustrated in Table 5.4 and neutron population increases linearly rather than exponentially.
5.7.1 Define subcritical multiplication.
Solution:
The multiplication of source neutrons in a subcritical reactor by positive reactivity additions.
5.5.2 What is the mathematical relationship between count rate increase and the multiplication factor, K, for a subcritical reactor?
Solution:
C = S/1-K
5.7.3 If the neutron flux diminishes during each succeeding generation when K is less than 1.0, why is it that the count rate increases in your reactor after each increment of control rod withdrawal, while subcritical?
Solution:
Source neutrons are being multiplied by increases in K. Without the neutron source, the subcritical neutron count would fall to a very low value.
C = S/1-K
As K increases toward 1, C increases toward infinity.
5.7.4 During startup an operator withdraws control rods until the reactor is shutdown by 6% ΔK/K, at which point the startup channel reads 5 cps. Rod withdrawal is continued until the reactor is shutdown by 0.5% ΔK/K. What would you expect the startup channel to read at this point?
Solution:
K1 = 1/(1-ρ1) = 1/(1+.06) = .943 K2 = 1/(1-ρ2) = 1/(1+.005) = .995 C2/C1 = (S/(1-K2))/(S/(1-K1)) C2 = C1(1-K1)/(1-K2) = 5(1-.943)/(1-.995) = 57 cps
5.7.5 A shutdown reactor has a normal source level of 10 cps. If Keff of the reactor is increased to 0.98, what should be the approximate count rate at this time?
Solution:
Co = 10 Ko = .97 (assumed shutdown K)
K1 = .98
Subcritical reactor:
Cn = S/(1-KN) Co = S/(1-Ko) C1 = S/(1-K1) C1/Co = (1-Ko)/(1-K1) C1 = 10(1-.97)/(1-.98) C1 = 15
5.7.6 While withdrawing rods to approach critical, the count rate doubles during an increment of rod movement. WHat will be the value of Keff if a second equal increment of rod poison is once again withdrawn from the reactor?
Solution:
K = 1; the reactor will be critical.
Co = S/(1-Ko)
C1 = S/(1-K1)
Co/C1 = (1-K1)/(1-Ko) = .5
K1 = .5 + .5Ko
K1-Ko = .5-.5Ko
K1 + (K1-Ko) = (.5+.5Ko) + (.5-.5Ko)
= 1
5.7.7 As you withdraw the shim rods from 10 to 15 inches, the count rate doubles.
(a) To what shim bank height would the shim rods be withdrawn to again double the count rate?
(b) What could cause your prediction in (a) to be inaccurate?
(c) If the initial Keff was 0.8, what is Keff after the second doubling?
Solution:
(a) 17.5 inches
(b) The analysis is based upon an assumed linear rod worth and optimum positioning of the source, fuel, and the detector.
(c) C = S/1-K
Co = S/1-.8
C2 = 4Co = S/(1-K2) = 4S/(1-.8)
1-K2 =(1-.8)/4
K2 = 1-.05
= .95
5.7.8 Given the following data on loading fuel into a reactor core,
(a) Plot a 1/M curve for both sets of data.
Count Rate
Fuel Elements Rod Out Rod In
0 20 10
8 30 15
16 50 40
24 150 33
28 4000 62
(b) What is the critical loading rods out and rods in?
(c) What are the rods reactivity worth?
(d) What would be the expected rods out count rate for 20 fuel elements?
(e) How many detectors are used for a loading experiment?
Solution:
(a) Elements Co 1/Mo Ci 1/Mi
0 20 1 10 1
8 30 .67 13 .76
16 50 .40 19 .52
24 150 .13 33 .30
28 4000 .005 62 .16
(b) Rods in: 34
Rods out: 28
(c) Rod Worth: 6 elements
C = S/1-K K = 1-S/C
Sout = 20 Sin = 10
K28out = 1-20/4000 K28in = 1-10/62
= .995 = .84
ρ28out = (.995-1)/.995 = -.0050
ρ28in = (.84-1)/.84 = -.1905
Δρ = -.0050-(-.1905) = .1855 ΔK/K
(d) 1/M20 = .28 = Co/C20 = 20/C20
C20 = 71 CPS
(e) Two minimum
5.7.9 For the critical loading data below:
No. of elements Detector A (CPS) B (CPS)
0 40 35
10 41 54
20 42 67
30 44 85
50 54 194
(a) Plot a 1/M curve for both detectors.
(b) Explain the discrepancy between curve A and curve B.
(c) Using curve B estimate the number of fuel elements for a critical core.
(d) Explain the principle you used to answer (c).
Solution:
(a) No. A 1/MA B 1/MB
0 40 1 35 1
10 41 .98 54 .65
20 42 .95 67 .52
30 44 .91 85 .41
50 54 .74 194 .18
(b) Detector A is located too far from fuel. Detector B too close initially but location with respect to final elements gives reasonable predictions.
(c) 65
(d) Projection of 1/M plot to horizontal axes corresponds to 1/M = 0, M = ∞, Cn = ∞, 1-K = 0, K = 1, reactor critical.
5.7.10 Assume a reactor is shutdown with a shutdown margin of 1.8%. If control rods are withdrawn until the count rate increases by a factor of 20, and the reactor is still subcritical, what is the new Keff?
Solution:
ρ1 = -1.8% ΔK/K K1 = 1/1-ρ1 = 1/(1+.018) = .982 C1 = S/1-K1 C2 = 20C1 = S/1-K2 C2/C1 = 20C1/C1 = S(1-.982)/S(1-K2) 20 = .018/1-K2 20(1-K2) = .018 K2 = 1-.018/20 = .999
5.7.11 Assume the reactor has an entirely new fuel loading and the critical rod positions are known.
(a) If the rods are placed in these positions with no neutron source in the reactor, what would you expect the reactor response to be?
(b) Now assume that a neutron source is introduced into the system. What do you expect the reactor response would be then?
Solution:
(a) When rods are in the critical position the reactor will be critical.
(b) When a neutron source is added to a critical reactor, neutron level will increase at a constant rate and the reactor will be supercritical. The change in neutron level per generation is equal to the number of neutrons per generation contributed by the source times the multiplication factor, K. Since K=1 when critical, the neutron population will increase linearly with source multiplication.
5.7.12 Why does it take longer for the subcritical neutron level to reach its now steady state value after an incremental rod movement as Keff approaches 1?
Solution:
C = S/1-K = S + KS + K2S + ..... + KnS
As K approaches 1.0, more and more terms in subcritical multiplication become significant. Since each term represents a generation time, it takes longer and longer to reach a new steady state value.
5.7.13 Explain what significance the term count rate doubling has with respect to reactor condition.
5.7.14 Explain what indication would look like if pulling rods were stopped during an approach to criticality.
5.7.15 During startup a nuclear engineer calculates that Keff = .92 when the LCRs are indicating 1.3x10³ cps. How many counts are the direct result of source neutrons?
5.7.16 Subcritical Count Rate is:
(a) Proportional to S, inversely proportional to Keff;
(b) Inversely proportional to S, proportional to Keff;
(c) Proportional to S and Keff;
(d) Inversely proportional to S and Keff.
5.7.17 Briefly describe how an operator can determine that the reactor is critical (Keff≥1) during a startup.
5.7.18 Briefly explain why the neutron source can be removed or is less important after extended power operation.
5.7.19 Two identical reactors are taken to the just critical level. Reactor A has a rod speed of 50 steps per minute while Reactor B has a rod speed of 25 steps per minute. (Assume continuous rod withdrawal).
(a) Which reactor will achieve criticality first?
(b) Which reactor will have the highest level of source range counts at criticality?
(c) Which will have the highest critical rod height? Explain your answers.
5.7.20 During a routine startup, the reactor is subcritical with a stable count rate of 100 cps. The operator withdraws rods and notes a count rate of 150 cps after he stops rod motion.
(a) If the operator performed no rod motion for five minutes, would the count rate increase, decrease, or remain the same? Explain.
(b) Would the change in count rate be different if the reactor was slightly subcritical (K = .995) as compared with greatly subcritical (K = .95)? Assume the same amount of rod withdrawal and explain your answer.
(c) Suppose the rods are not moved for two hours. What would you expect count rate to do over that period? Assume no temperature/poison change and explain your answer.
5.7.21 Assume a hypothetical reactor with the following characteristics:
(a) Average thermal flux at power = 2x10¹² n/cm2 sec;
(b) Average moderator temperature = 90 F;
(c) Keff with all rods in = 0.90;
(d) Design maximum thermal power = 5 Mw.
The subcritical count rate has increased by a factor of 20 since initial control rod withdrawal began, what is the effective multiplication factor (Keff) for this reactor with the rods partially withdrawn?
5.7.22 If the neutron flux diminishes during each succeeding generation when K is less than one, why is it that the count rate increases in the reactor after each increment of control withdrawal while subcritical?
5.7.23 In a cold clean core there is an indicated count rate on a Source Range Monitor of 10 cpm.
(a) If the core has Keff of 0.9, how many of the indicated counts are caused by neutrons actually emitted by the source? Show your work.
(b) What factors could cause your source calculation to be inaccurate?
5.7.24 In the course of a reactor startup, it is desirable to know how close the reactor is to criticality.
(a) Briefly describe how the operator knows when the reactor is still subcritical but that he is very close to criticality.
(b) Briefly describe how the operator knows when the reactor goes critical.
5.7.25 During a reactor startup, rods are to be withdrawn 12 inches. The count rate increases from 47 to 90 on one source range instrument and from 37 to 75 on the other instrument after the first six inches of rod withdrawal. Should you proceed with the second six inch pull? Explain your answer.
5.7.26 During a reactor startup, it has been determined that Keff = 0.98:
(a) What indications on nuclear instrumentation tell you that the reactor is subcritical?
(b) How much reactivity do you need to add to make the reactor critical?
5.7.27 Assume the reactor is shutdown with a margin of 6.5% ΔK/K and has a count rate of 250 cps. If rods worth 4.2% ΔK/K are withdrawn, what will the new count rate be? Show all work.
5.7.28 The reactor count rate is 30 cps when K-effective is 0.90. How much reactivity would be required to give a count rate of 50 cps? Specify units of reactivity.
5.7.29 You are approaching criticality by a pull and wait rod movement.
(a) Does the startup instrumentation require the same time to level out at each subcritical level?
(b) Explain your answer.
5.7.30 A reactor operator observed during his training that the reactor achieved criticality at approximatley 3000 cps. He reasoned that during any later startup he would merely pull control rods until a neutron level of 3000 cps is reached and the reactor will be critical. Do you agree or disagree. Explain.
5.7.31 During a reactor startup, the operator observed the count rate to have doubled during each of two successive rod withdrawals.
(a) Was the reactor: critical, subcritical, or supercritical? Show all assumptions and calculations.
(b) If the reactor was subcritical or supercritical, by how much?
Excess reactivity, in the form of fuel loading, is added to a reactor to compensate for fuel burnup during a cycle, fission product poisons, experiments, and reactivity coefficients associated with moderator temperature and coolant voids.
After studying the lesson material and working exercise problems, the student should be able to:
1. Define excess reactivity, Kex, shutdown margin, moderator temperature coefficient, void coefficient, overmoderation, and undermoderation.
2. Sketch a typical moderator temperature coefficient versus moderator temperature curve and explain the effects of changes in moderator temperature.
3. Sketch and explain a plot of Keff versus moderator-to-fuel ratio in the core.
Excess loading of uranium-235 in the core provides a large amount of positive reactivity. At initial criticality, prior to going to power, the excess positive reactivity of the fuel is compensated for by negative reactivity in control rods.
When a reactor is brought to power, an increase in primary coolant temperature results in negative reactivity insertions which must be compensated for by rod withdrawal. This negative reactivity effect during a power increase from zero to full power is commonly called the power defect.
During operation, large amounts of negative reactivity result from the buildup of neutron absorbing fission products, xenon-135 and samarium-149. Longer term, but very small, reactivity effects result from plutonium-240 resonance absorber production (negative) and plutonium-239 and plutonium-241 fissile material breeding (positive).
Define the power defect.
The power defect is negative reactivity inserted by an increase in moderator temperature within the core when the reactor is brought from zero to full power.
The excess multiplication factor, Kex, provides a measure of extra fuel loaded into a reactor core above the amount needed to be critical in order to compensate for fuel burnup, experiment insertions, fission product poisons, and the power defect during operation. From a practical point of view, the fission product poison, samarium-149, is considered to be in perpetual equilibrium because it has a very long half life when compared to the ten day operating cycle. The reactivity effect of samarium-149 is not considered when determining fuel loading and the core's excess multiplication factor, except for the very first core fuel loading.
Kex = Keff-1 (6.1)
Kex is the value of Keff above criticality for a core at the beginning of a cycle, cold, xenon free, with all rods withdrawn from the core. At initial startup and during subsequent operation, control rods must be inserted as needed to overcome Kex and maintain reactor criticality.
Define Kex.
With all rods withdrawn from a reactor core, Kex = Keff-1. It provides a measure of excess reactivity available to overcome fission product buildup, fuel burnup, and power defect.
Excess reactivity, ρex, is the amount of positive reactivity in a reactor core corresponding to the Kex in section 6.2.1.
ρex = (Keff-1)/Keff
= Kex/(1+Kex) (6.2)
An example of the approximate reactivity balance in a research reactor is illustrated in Figure 6.1.
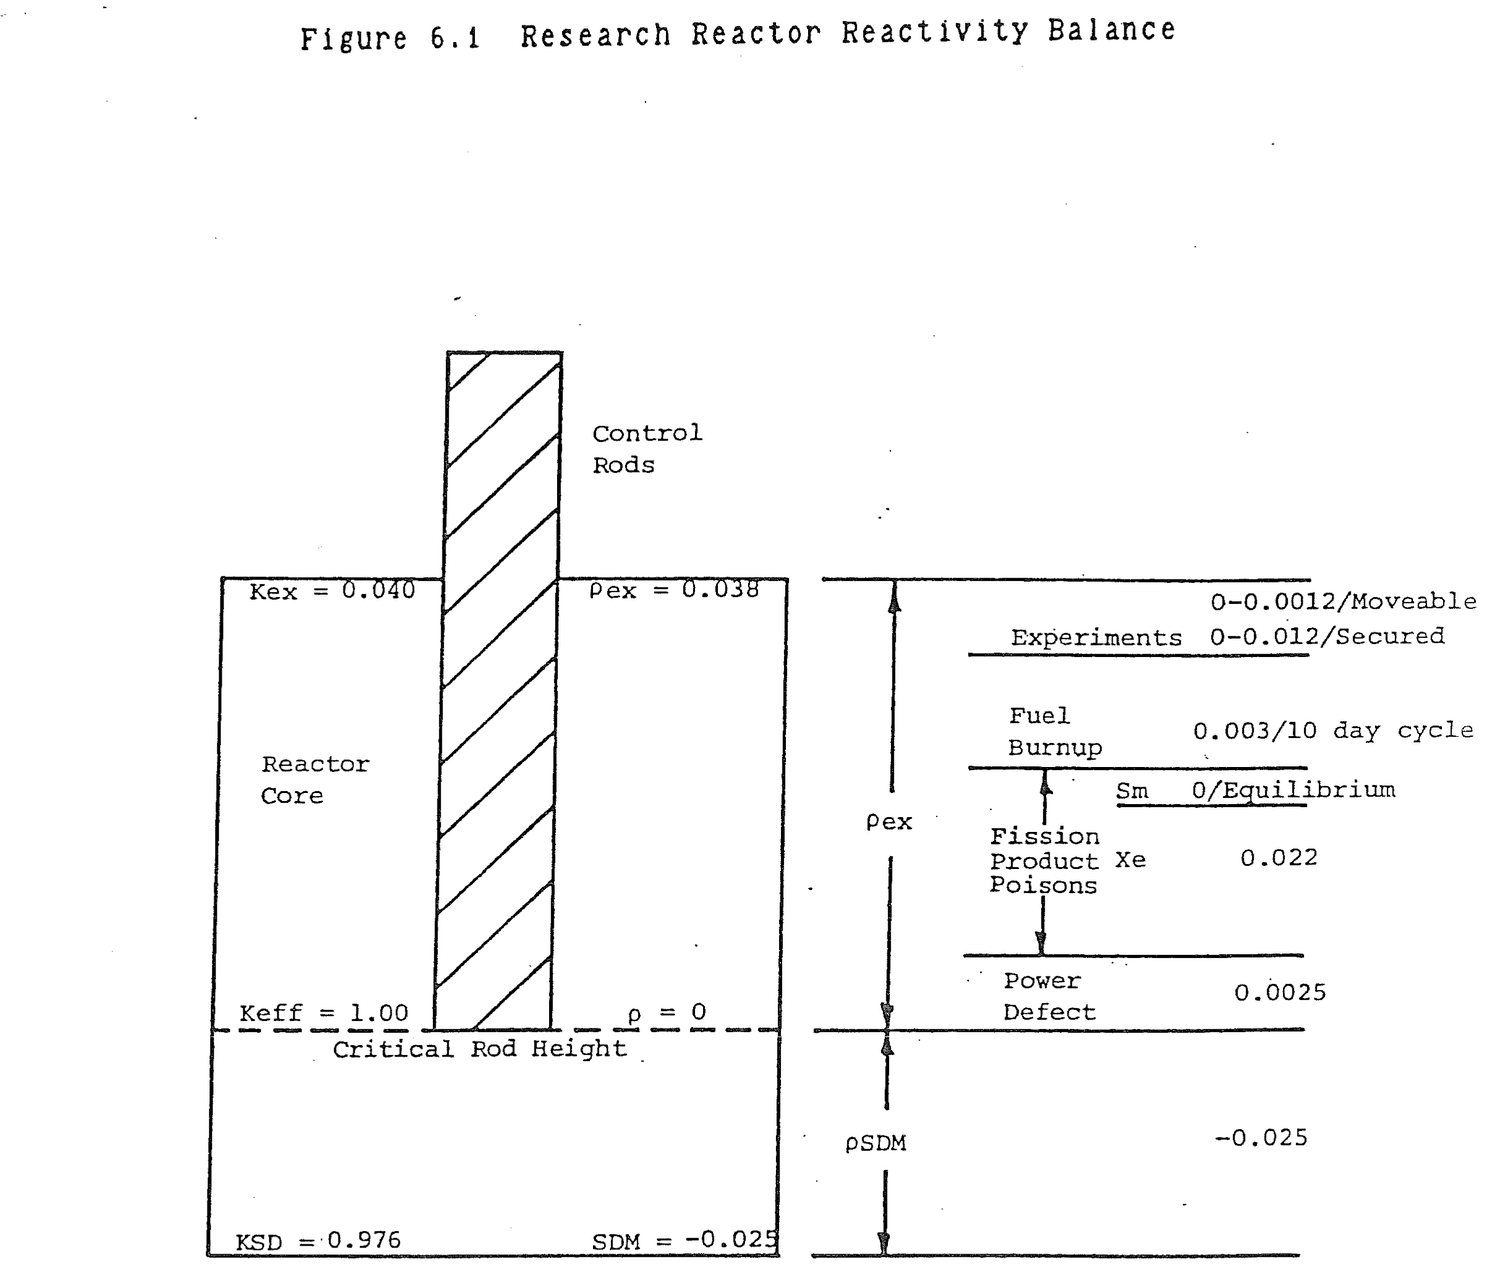
Define excess reactivity.
ρex = (Keff-1)/Keff with all rods withdrawn from a core that is cold and xenon free.
Shutdown margin, SDM, is the amount of negative reactivity that would be inserted into a reactor core if all rods were dropped from critical height. Technical specifications for a reactor specify the minimum value of SDM if all rods are inserted and if one rod remains stuck in the fully withdrawn position. Technical specifications also specify the maximum excess 3eactivity permitted in a core. Thus, as illustrated in Figure 6.3, a reactivity balance exists between the minimum required SDM and the maximum allowed ρex. In practice, the minimum SDM usually dictates the amount of ρex that can be present.
Define shutdown margin.
SDM is the amount of negative reactivity that would be added to a core if the rods in a critical, cold, clean reactor were fully inserted.
The reactivity effects that accompany a change in power level are mainly the result of changes in moderator temperature and void fraction. Under ordinary circumstances, void fraction is zero because the boiling point is not reached within the core. However, voids can be produced artificially by the insertion of experiments.
In reactor design, moderator temperature and void increases insert negative reactivity. During reactor operation, an increase in power output due to a positive reactivity insertion produces negative reactivity feedback because of moderator temperature and void volume increases which tend to limit the power increase. Were the effect reversed, positive reactivity would cause power to increase which in turn would insert more positive reactivity. The reactor would have an uncontrolled increase in power.
In power reactors, increases in fuel temperature produce rapid negative reactivity feedback as a result of the Doppler coefficient. This effect is not seen in the Ford Nuclear Reactor because of the very low uranium density in the fuel and because temperature variations across fuel plates are less than 1 F.
What is meant by the negative feedback effect of a power increase in a reactor?
When power increases, moderator temperature and void volume increase which add negative reactivity and tend to decrease reactor power.
Reactivity and temperature change are related by:
ρ = αT(ΔT) (6.3)
where:
ρ = Reactivity, ΔK/K αT = Moderator Temperature Coefficient, ΔK/K/F ΔT = Temperature change, F
At normal operating temperatures, a reactor has a negative moderator temperature coefficient which results from a decrease in moderator density in the core with increasing temperature. Since water molecules supply the principal nuclei for thermalizing neutrons, as density decreases, less moderation occurs near fuel rods, more neutrons leak from fuel into the control rods and out of the core, and a net negative reactivity results.
Moderator temperature coefficient is not constant, as can be seen in Figure 6.2, because one degree temperature change causes a greater water density change at higher temperatures than at lower temperatures. Temperature coefficient ranges from as low as -5x10⁻⁵ ΔK/K/F at 100 F to approximately -20x10-5 ΔK/K/F at 550 F. A 50 F temperature change between 150 F and 200 F causes a density decrease from 61.2 lbm/ft3 to 60.13 lbm/ft3, a decrease of 1.07 lbm/ft3. A 50 F change from 500 F to 550 F causes a density decrease from 49.02 lbm/ft3 to 45.92 lbm/ft3, a net decrease of 3.1 lbm/ft3.
In a research reactor, moderator temperature remains almost constant, so moderator temperature coefficient is considered essentially constant.
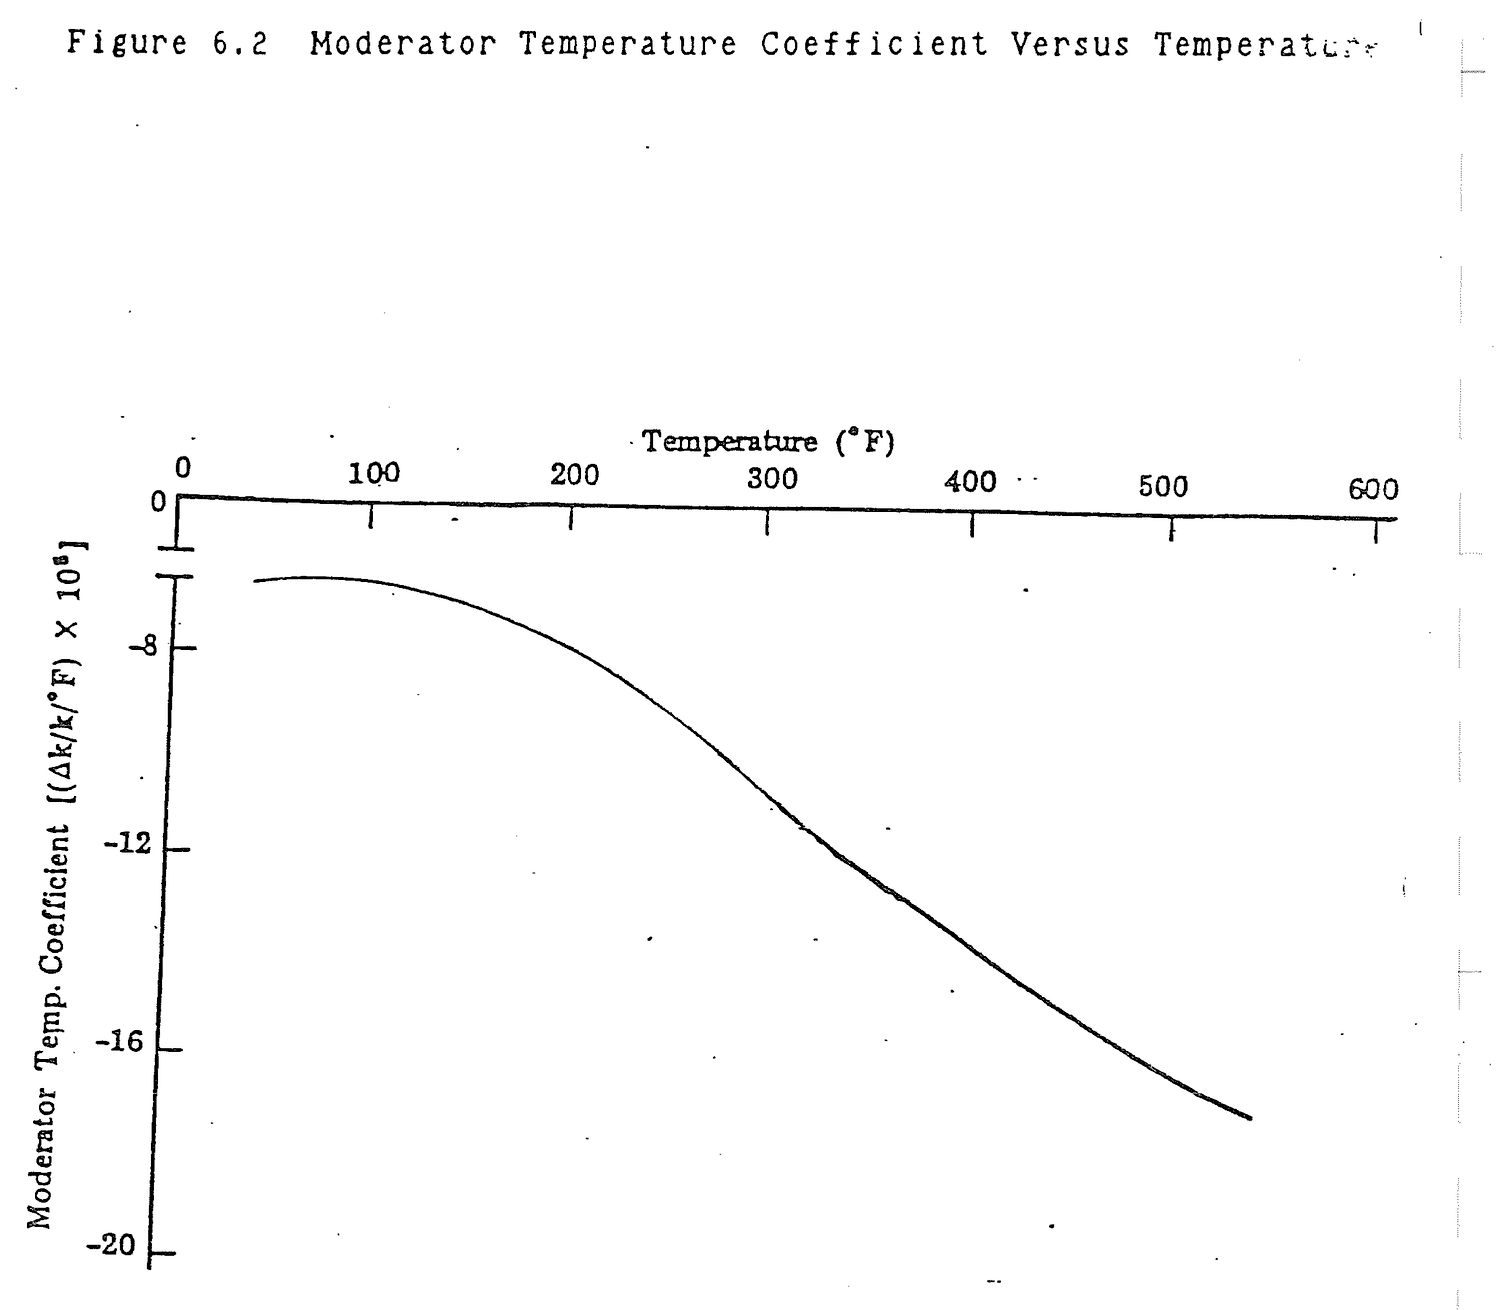
Why is the magnitude of moderator temperature coefficient smaller at low reactor operating temperatures?
Moderator temperature coefficient is a function of decrease in moderator density per F. The density decrease per F is greater at high moderator temperatures.
The core moderator to fuel ratio, NH2O/NFuel, is the ratio of the number of moderator or water atoms within the core volume to the number of fuel atoms. As temperature increases, fuel volume and number density remain essentially constant. Moderator volume remains constant, but the number density decreases as density decreases at increased temperature.
The amount of water affects Keff through thermal utilization factor, resonance escape probability, fast fission factor, and the non-leakage probabilities as shown in Figure 6.3(a). Of these factors, thermal utilization factor and resonance escape probability are affected more strongly.
The thermal utilization factor will be highest if there is no water in the core. The thermal utilization factor is basically considering the percentage of neutrons in the core that are absorbed in the fuel. If there were no water and no absorption by the hydrogen and oxygen atoms, then a higher percentage of neutrons would be absorbed by the fuel atoms. If one assumes a simplified reactor of only fuel and moderator, then with no water, f approaches one. As water is added to the core, f approaches zero.
If one now examines the resonance escape probability one finds that there is a decrease in the resonance escape probability as the moderator to fuel ratio decreases. The uranium atoms do not serve well as a moderator and the neutrons will take a long time to slow down. They will lose very little energy in each collision. It will be impossible for them to escape resonance absorption peaks, so they will be absorbed and lost from the fission chain reaction. However, as more and more water molecules are added relative to the amount of fuel molecules, than it becomes easy for neutrons to slow down to thermal values without encountering a resonance absorber while at the resonance energy level. The probability of resonance escape approaches 1.
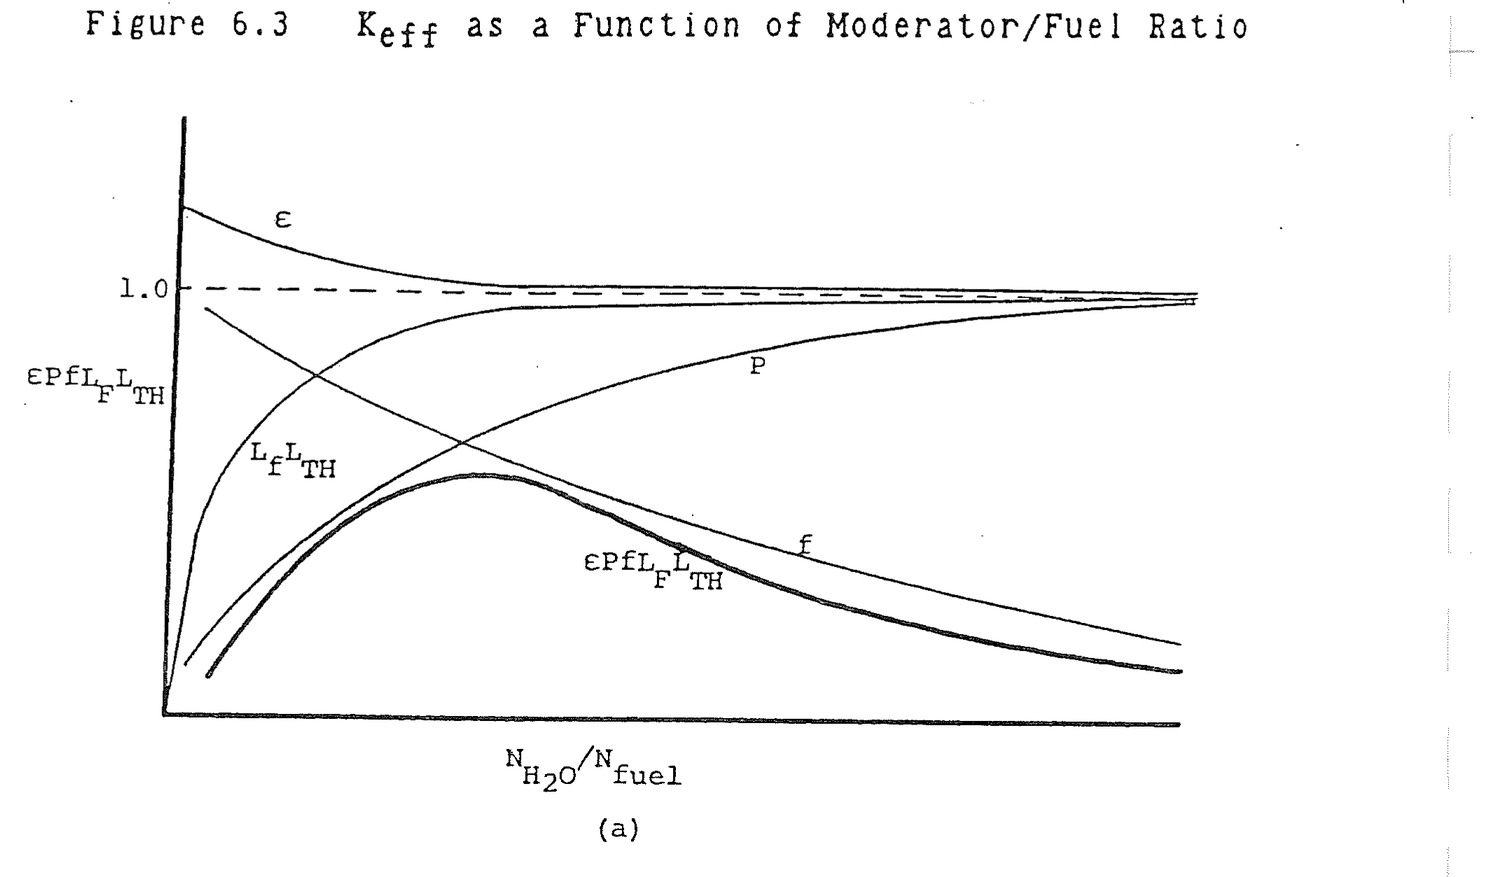

The fast fission factor tends to be greater as the moderator to fuel ratio is reduced in a reactor. However, it does not exhibit a significant variation with the NH2O/Nfuel ratio as is shown in Figure 6.3(a).
The moderator to fuel ratio also affects the non-leakage probabilities, Lf and LTH. As the amount of the moderator is decreased, the slowing down length and neutron diffusion length increase, causing more leakage. Recall that the non-leakage probabilities are related to the slowing down length and the thermal neutron diffusion length. As a result, the product of the non-leakage probabilities tends to be small as the moderator to fuel ratio approaches zero and approaches one as the moderator to fuel ratio becomes large.
If one now considers the product of all the six factors comprising Keff and plots Keff versus moderator to fuel ratio, Figure 6.3(b) results. At low moderator to fuel ratios, Keff is small principally because P is small. At large ratios, Keff is small because f is small. At an intermediate value of moderator to fuel ratio, between 2,0 and 4.0, Keff is at its maximum value. An undermoderated core has moderator to fuel ratio values less than the value at maximum Keff. Values above the maximum Keff point produce overmoderated cores,
The operating range of the moderator to fuel ratio is determined by the design of the reactor core. From Figure 6.3(b), it can be seen that at 70 F, an increase in temperature results in positive reactivity addition which means that the moderator temperature coefficient is positive. Conversely, at 550 F, αT is negative because an increase in temperature causes a negative reactivity addition. Reactor cores are designed to operate slightly undermoderated. An increase in power results in negative reactivity which tends to make the reactor self regulating.
How do f, P, ε, LF, and LTH vary as moderator to fuel ratio increases?
Increases Decreases P, LF, LTH f, ε
How does Keff vary with moderator to fuel ratio?
NH2O/NFUEL Keff Explanation
0 0 No neutron moderation
2-4 Peak, 1.2
∞ 0 Total neutron absorption
in moderator
Undermoderation means that too little or less than optimum water exists between adjacent fuel rods or plates in a reactor core. Overmoderation means too much water exists between adjacent fuel rods or plates. The optimum width of the moderator gap would be such that fission neutrons produced in one fuel rod would be thermalized in the water gap and produce a peak thermal flux in an adjacent rod. This explanation is idealized because coupling exists between a source fuel rod which is producing neutrons and more than one coupled rod in the vicinity, but the principle behind it is correct.
Figure 6.4(a) illustrates two undermoderated fuel rods. The source fuel rod produces fast neutrons which begin to thermalize as they enter the water gap. At temperature, T1, the thermal flux profile, φTH, is as shown. Because the fuel is undermoderated, the thermal flux peaks beyond the coupled fuel rod. The reaction rate which sustains reactor power is R = ΣfφTH. As temperature increases to T2, less moderation occurs, the source neutron slowing down length increases, the thermal flux profile stretches out in distance, and the thermal flux in the coupled fuel rod decreases. This reduces the fission reaction rate which is, in effect, a negative reactivity insertion. Power decreases. A positive temperature increase has resulted in negative reactivity. From equation (6.3), moderator temperature coefficient is negative. Similarly, in Figure 6.4(b), it can be seen that in undermoderated fuel, insertion of a void cuts down on the amount of moderation in the water gap, reduces the thermal flux in the coupled fuel rod, and produces negative reactivity. A positive void insertion results in negative reactivity which means the void coefficient is negative.
In overmoderated fuel as in Figure 6.4(c), the source fuel rod thermal flux peak occurs in the water gap. An increase in moderator temperature, as explained above, causes the thermal flux peak to move out toward the coupled rod resulting in a higher thermal flux in the coupled rod, an increased reaction rate, and positive reactivity. A positive temperature increase has resulted in positive reactivity. Moderator temperature coefficient is positive.

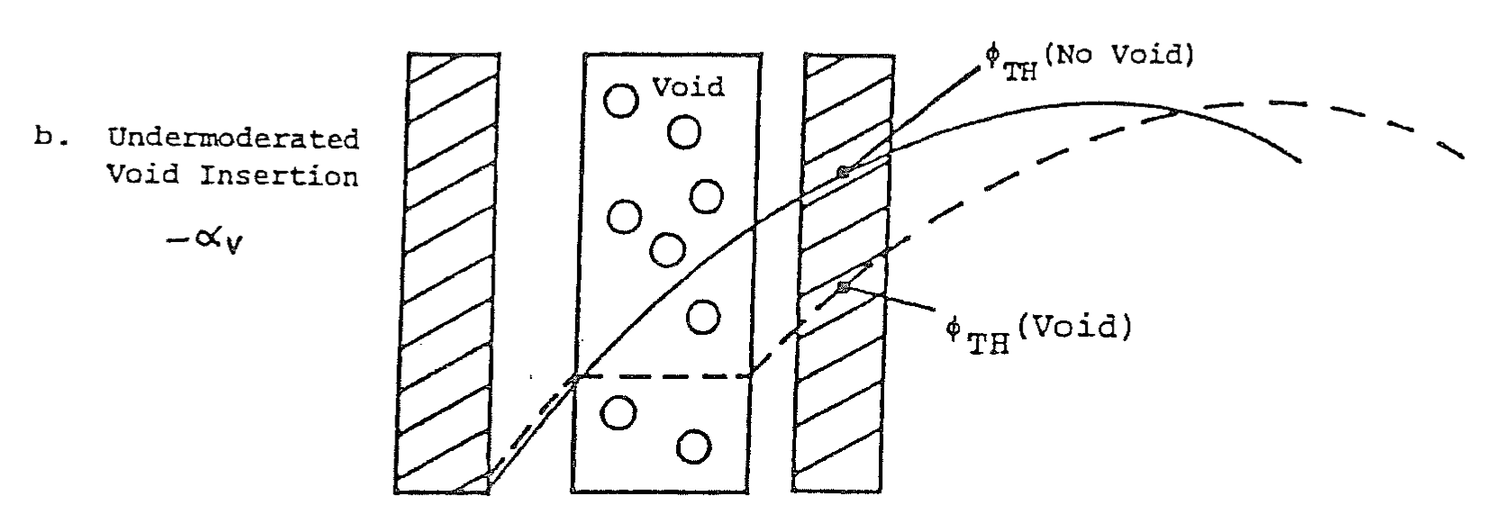
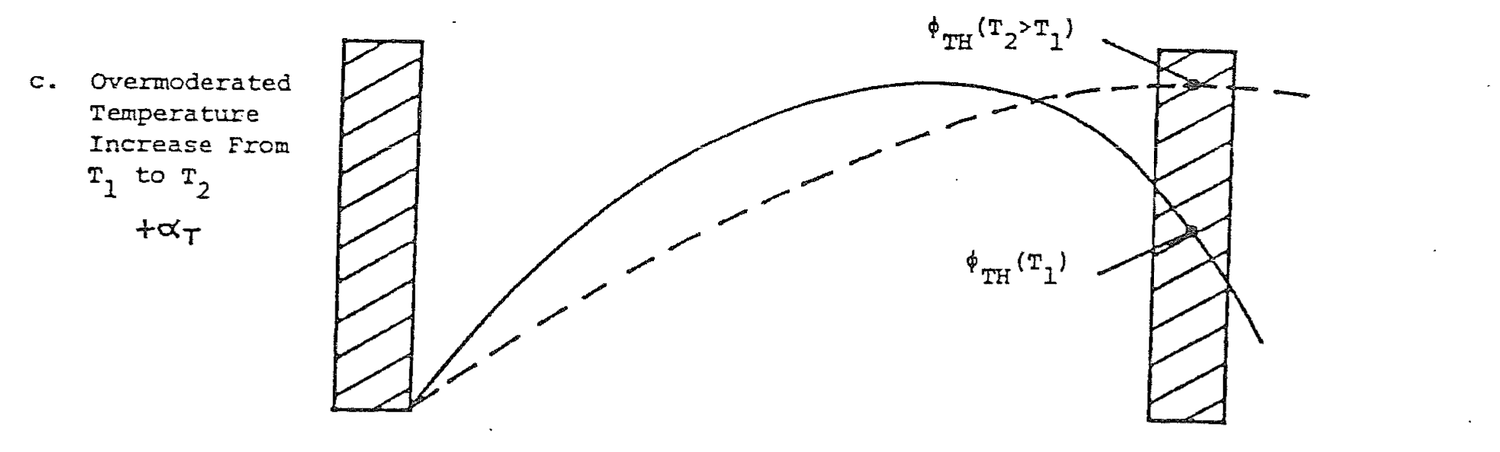
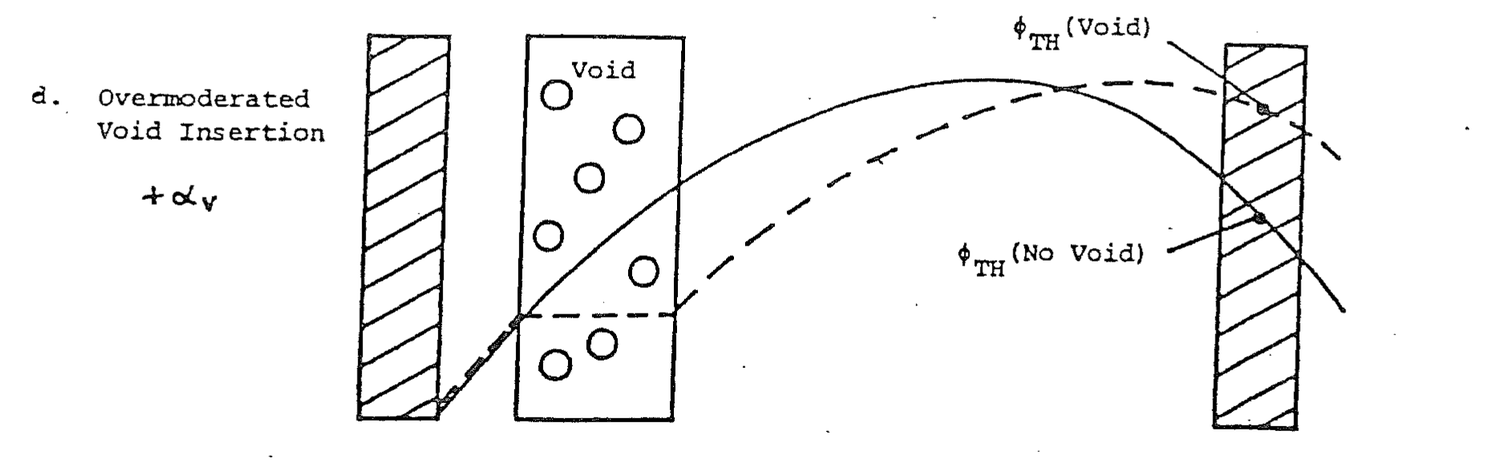
Similarly, from Figure 6.4(d), in overmoderated fuel, insertion of a void increases the thermal flux in the coupled fuel rod which has a positive reactivity effect. A positive void insertion results in positive reactivity. Void coefficient is positive.
Reactors are designed to have negative temperature and void coefficients, but local positive coefficients exists in areas with large water gaps that are overmoderated such as in control rod channels.
Define overmoderation and undermoderation.
Overmoderation means that the moderator to fuel ratio is greater than optimum for proper moderation and interaction between fuel rods. Primarily because of neutron absorption in water and a decrease in f, Keff is less than maximum. An increase in moderator temperature or voids inserts positive reactivity.
Undermoderation is the normal condition for most reactors. Moderator to fuel ratio is less than optimum primarily because of resonance absorption. An increase in moderator temperature or voids inserts negative reactivity.
Reactivity and core void content are related by:
ρ = αV(ΔV) (6.4)
where:
ρ = Reactivity, ΔK/K; αV = Void coefficient, ΔK/K/%; ΔV = Void change, %.
Void coefficient is usually associated with a boiling water reactor because of the bulk in-core boiling, but a research reactor can experience void effects during transients and as the result of insertion of experiments into the core.
An increase in void concentration in the core affects neutron multiplication factor terms as follows: (1) η remains constant; (2) ε remains essentially constant though it may increase slightly; (3') P decreases due to increased resonance absorption; (4) f increases due to decreased moderator absorption;
(5) Lf and Lth decrease slightly due to increased slowing down length and migration length.
Void coefficient is slightly less negative at high moderator temperatures than at low moderator temperatures. At low moderator temperatures, a one percent void causes a greater decrease in moderator density than does a one percent void increase at high moderator temperatures.
6.5.1 What fundamental processes in a reactor core account for a negative moderator temperature coefficient of reactivity? Explain in detail.
Solution:
Negative moderator temperature coefficient results from a decrease in moderator density with increasing temperature. Since water molecules supply the principle nuclei for thermalizing neutrons, as their density decreases less moderation occurs and more neutrons leak from the core. The increase in leakage decreases neutron multiplication producing a net negative reactivity effect.
6.5.2 When the average moderator temperature increases, which of the following increase or decrease? Explain.
(a) Numbers of neutrons absorbed in the control rods (Assuming the rods do not move).
(b) Number of neutrons leaking from the core.
(c) Number of neutrons absorbed in the fuel compared to those absorbed in the moderator.
Solution:
(a) An increase in moderator temperature would cause increased leakage of neutrons into areas where the rods are, resulting in greater neutron absorption by the rods.
(b) An increase in temperature expands water so that there are fewer water molecules in the core. Since water supplies the principle nuclei for slowing down neutrons, the decrease in number of water molecules allows more neutrons to escape from the core.
(c) The number of neutrons absorbed by fuel and moderator can be written as Σf = σfNf and Σm = σmNm. Nf remains constant in fuel and Nm changes in moderator. The number of neutrons absorbed in moderator will decrease by a greater % than in fuel.
6.5.3 If the average moderator temperature in the core decreased suddenly by 10 F, approximately what reactor period would be initiated?
Solution:
αT = -15x10-5 ΔK/K/F ρ = αT ΔT = (-15x10-5 ΔK/K/F)(-10 F) = 15x10-4 ΔK/K T = (β-ρ)/λρ = (.0075-.0015)/(.1)(.0015) = 40 seconds
6.5.4 List five reasons for loading excess core reactivity. Give an approximate magnitude of each reactivity listed.
Solution:
Reactivity, ΔK/K
(a) Power Defect 0.0025
(b) Xenon 0.0220
(c) Fuel Burnup 0.0030/10 day cycle
(d) Experiments 0-0.0012/moveable
0-0.0120/secured
6.5.5 If, at the beginning of core life in a reactor, Keff is known to be 1.28:
(a) What is the value of Kexcess?
(b) What is the reactivity, in percent?
Solution:
(a) Kexcess = Keff-1.0 = 1.28-1.0 = .28
(b) ρ = .28/1.28 = .219
= 21.9 %ΔK/K
6.5.6 Explain the effect the selection of the proper moderator/fuel ratio has on moderator temperature and void reactivity coefficients.
Solution:
Small moderator/fuel ratio means that neutrons are not optimally thermalized before interacting with adjacent fuel plates. This undermoderation results in even less thermalization as temperature increases; negative reactivity; negative temperature and void coefficients. Large moderator/fuel ratio means that optimum thermalization occurs somewhere in the water gap. As temperature increases this flux peak shifts to adjacent fuel; positive reactivity; overmoderation; positive temperature and void coefficients.
6.5.7 Keff varies with moderator to fuel ratio as shown in Figure 6.3.
(a) At operating temperature of 100 F, would the reactor during normal operation have:
1. Positive or negative moderator temperature coefficient. Explain.
2. Positive or negative void coefficient. Explain.
(b) At 500 F, would the reactor have:
1. Positive or negative moderator temperature coefficient. Explain.
2. Positive or negative void coefficient. Explain.
Solution:
(a) 1. Temperature increases
NH2O decreases
NH2O/Nfuel decreases
K increases at 100 F
+ αT
2. Void insertion
NH2O decreases
NH2O/Nfuel decreases
K increases at 100 F
+ αV
(b) 1. Temperature increases
NH2O decreases
NH2O/Nfuel decreases
K decreases at 500 F
- αT
2. Void insertion
NH2O decreases
NH2O/Nfuel decreases
K decreases at 500°F
- αV
6.5.8 Explain how moderator temperature coefficient varies with moderator temperature.
6.5.9 Explain the relationship between the point of adding heat and reactor power level.
6.5.10 Explain what is meant by over and undermoderation and the effects on core reactivity coefficients.
6.5.11 If a reactivity coefficient is negative:
(a) Parameter increases and K increases;
(b) Parameter increases and K decreases;
(c) Parameter decreases and K decreases;
(d) Parameter decreases and K increases;
(e) (a) and (c) correct;
(f) (b) and (d) correct;
(g) All of the above correct.
6.5.12 (a) Explain why it is desirable to avoid positive coefficients of reacitvity.
(b) What are two factors which will cause the moderator temperature coefficient to become more positive?
before the other two coefficients.
6.5.13 Describe the effects of moderator temperature on the worth of control rods.
6.5.14 Assume the initial reactor core was loaded to an effective multiplication factor of 1.257 with all rods out.
(a) Since the multiplication factor (K) of an operating reactor is 1.000, why is the core loaded with so much Kexcess? List three reasons.
(b) How is the excessive amount of reactivity held down in the reactor?
(c) Explain what is meant by a 1% Shutdown Margin.
6.5.15 What happens to the neutron flux as fuel burnup occurs?
6.5.16 Give the spatial location and the conditions in a reactor which can result in the local moderator coefficient being positive. Explain.
The primary functions of control rods are reactor shutdown and to perform startups and power changes. The absorber materials in the control rods is boron.
After studying the lesson material and working exercise problems, the student should be able to:
1. Define rod shadow and describe its causes and effects.
2. Sketch typical differential and integral rod worth curves and explain the shapes.
3. Explain the significance of a point on the differential and integral rod worth curves.
4. Construct an integral rod worth curve from a differential curve or from differential data.
Control rods are moved axially in discrete increments between fully inserted and fully withdrawn. Each incremental change in rod position produces a reactivity insertion in the reactor. A plot of incremental reactivity (ΔK/K/in) as a function of the axial rod position (in) in the core is called a differential rod worth curve.
Construction of a differential rod worth curve is illustrated in Figure 7.1. Reactor power is stabilized at a level well below the point of heat addition, that is, the point below which a change in power produces no appreciable change in moderator temperature. The rod which is to be calibrated is fully inserted in the core. The remaining rods are adjusted as desired to maintain criticality. With the reactor exactly critical, pull the inserted rod an increment. In Figure 7.1.a, the rod is pulled 25%. With a stopwatch, measure doubling time, the time required to double reactor power, on a power level recorder or meter. Once doubling time has been measured, insert the other rods to reestablish criticality at the starting power level with the rod of interest at 25%.
From doubling time, calculate reactor period.
P(td) = 2P(0) = P(0)etd/T (7.1)
where:
td = Doubling time, sec.
Solve equation (7.1) for period in terms of doubling time.
2 = etd/T ln2 = td/T T = td/ln2 (7.2)
Calculate the reactivity that resulted from the 25% rod pull.
ρ = βeff/(1+λT) (7.3)
In fact, this calculation is approximate because λ (=1/τ) changes during a reactivity transient. As power increases, delayed neutron fraction growth does not keep up with prompt neutron growth. As a result τ, the delayed neutron generation time, becomes shorter because it is more dependent on shorter lived delayed neutron precursors which come closest to keeping pace with the growth of the prompt neutron fraction. As τ shortens, λ becomes larger and ρ in equation (7.3) is less than the calculated value using a fixed λ. For reasonable reactivity insertions, the difference is small.
Calculate differential reactivity. Divide the reactivity in equation (7.3) by the number of inches of rod motion; ΔK/K/in. Determine the midpoint of rod motion. Plot differential reactivity versus rod position as shown on Figure 7.1.a.
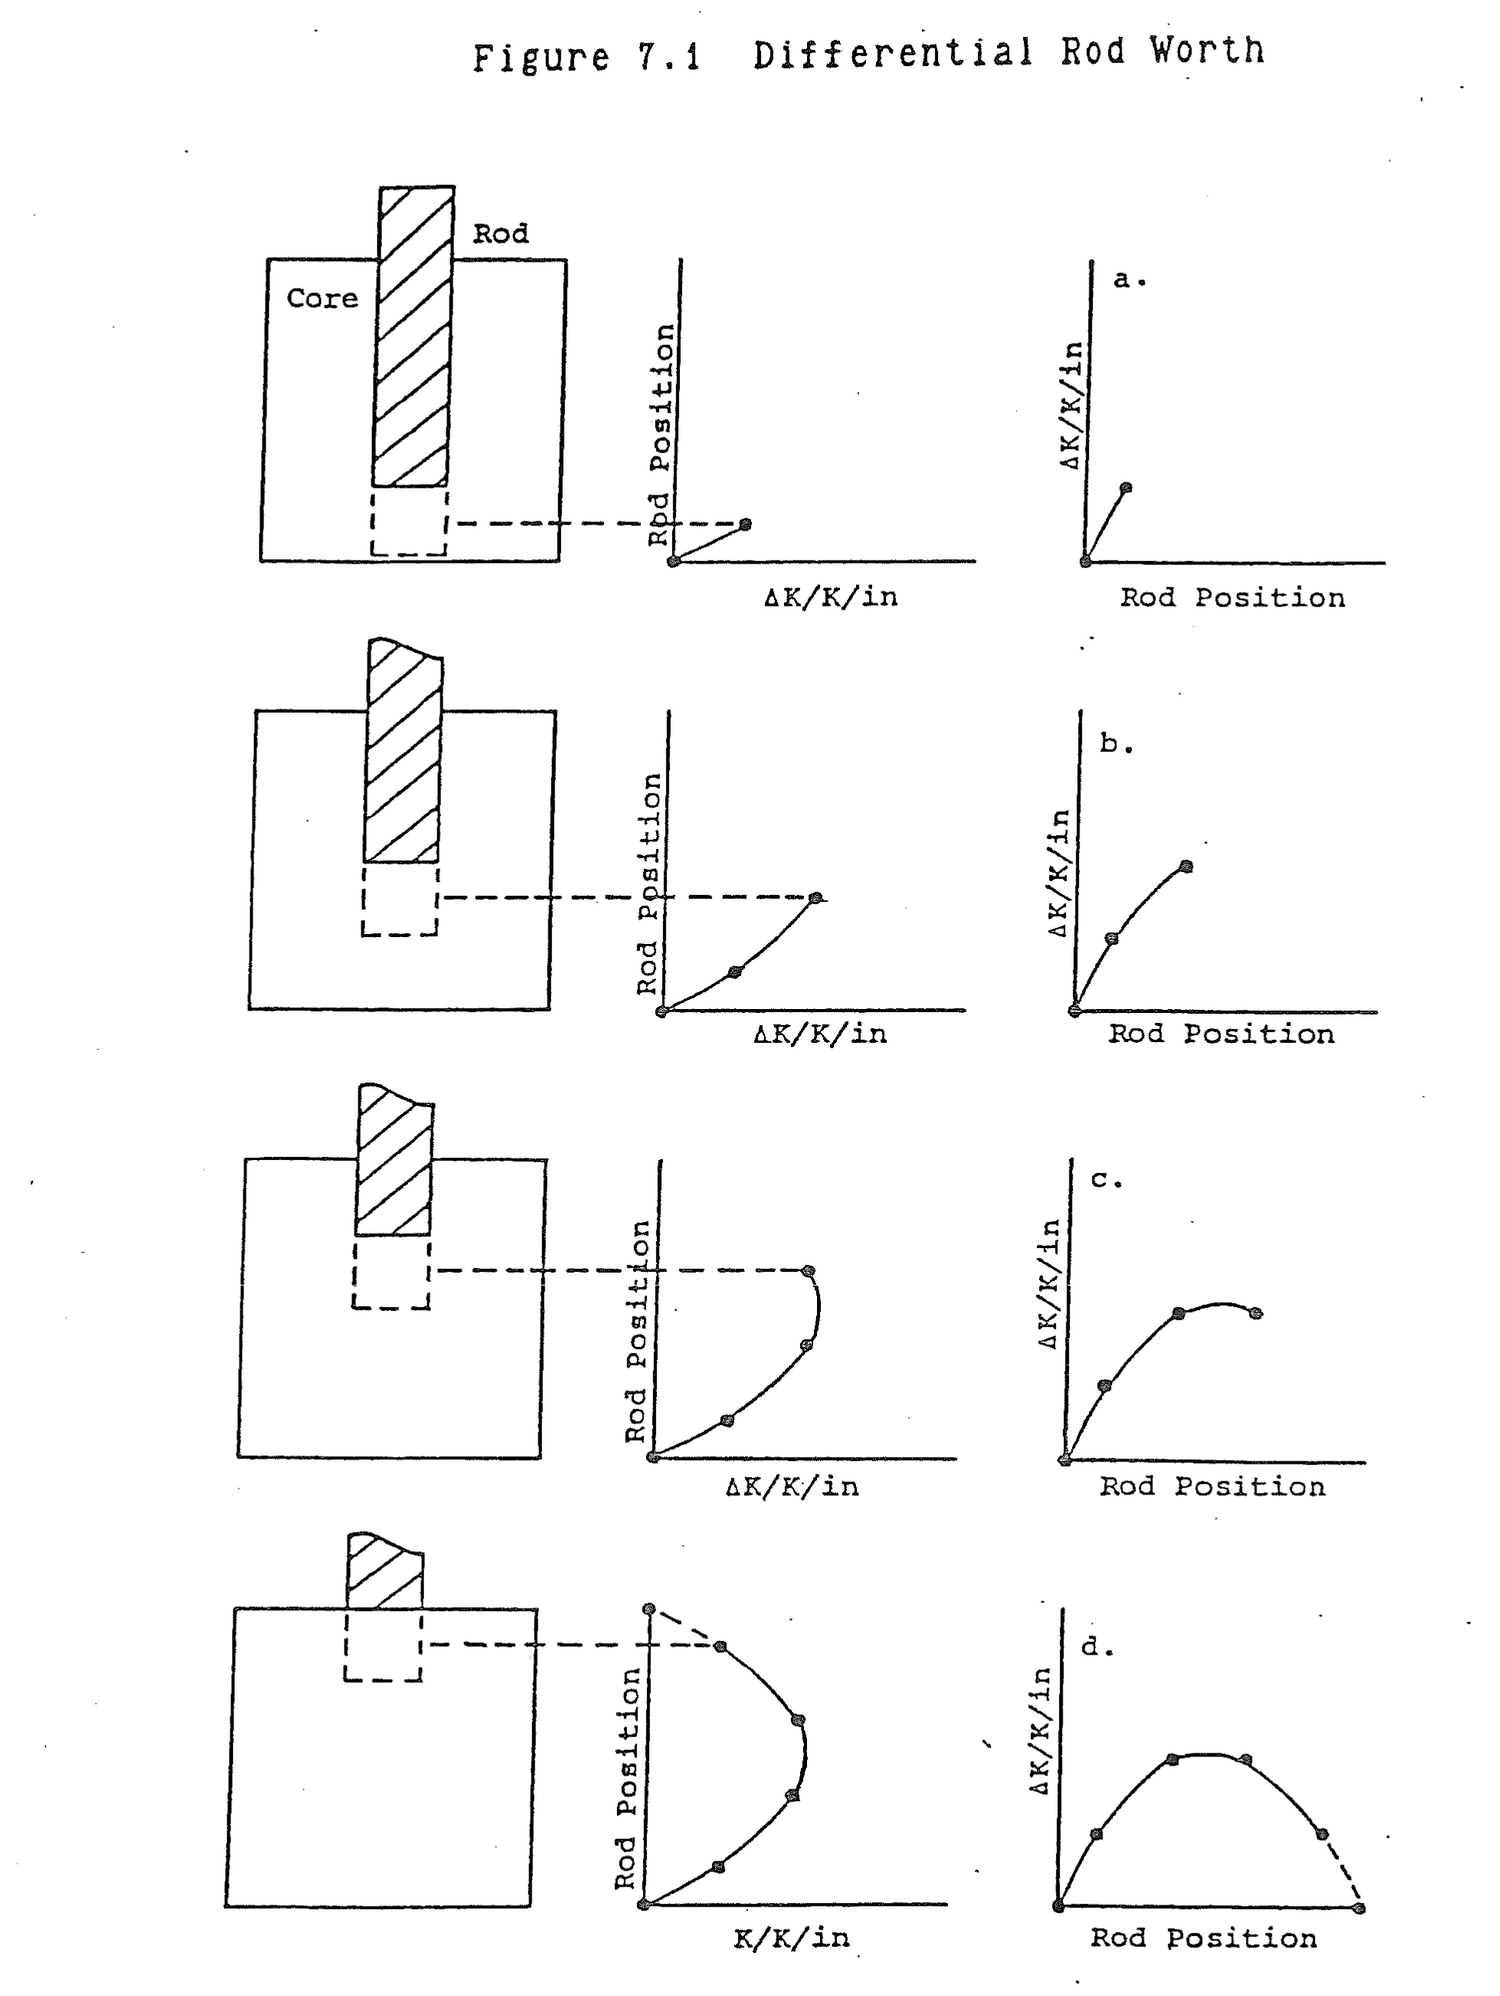
Again, with the reactor exactly critical at low power, pull the rod over another increment. Measure doubling time, calculate differential reactivity, and plot this differential reactivity versus the midpoint of the pull as in Figure 7.1.b.
Repeat this procedure over the full length of the rod. At each pull, plot differential reactivity versus the midpoint of the pull. The cumulative plot, as shown in Figure 7.1.d is the differential rod worth curve. At the two end points, the top and bottom of the core, differential rod worth is zero. Two orientations of the curve are shown. The left curve has rod position vertical just as the rod moves in the core. The right curve is reoriented in the more traditional manner with rod position along the horizontal axis.
Differential reactivity at any rod position corresponds to the amount of reactivity that one inch of rod motion would insert at that position. The differential reactivity is lowest at the top and bottom of the core and greatest at the center. This exactly corresponds to core flux shape. A rod has the greatest reactivity effect when it is moved in the highest flux because rod worth is simply an absorption reaction rate, R = Σaφ. It is difficult to determine the reactivity that is inserted by a large rod pull using the differential rod worth curve. At each inch along the pull, differential worth must be determined and all of these values must be summed over the full length of the pull. An integral rod worth curve is prepared for convenience to accomplish this summation over the full length of the rod.
Describe the general shape of a differential rod worth curve.
The differential curve conforms to axial flux shape. In general, it is cosine shaped, peaking at mid core and minimum at the top and bottom of the core.
What is the meaning of any point on a differential rod worth curve?
Any point on the curve represents the amount of reactivity that one inch of rod motion would insert at that position in the core.
Construction of an integral rod worth curve from a differential worth curve is illustrated in Figure 7.2. Starting at the bottom of the core, move up one inch of rod position. At that point, observe the differential worth value. That value is not truly representative of the differential worth over the first inch. Some lower value is. The product of the estimated differential worth times the inch of motion is the cross hatched rectangular area shown on Figure 7.2.a. The cross hatched area should be equal to the actual area under the curve up to that position. The actual area, which is the summed or integral worth up to that position, is shown dotted in Figure 7.2.a. The units of the hatched area are differential worth (ΔK/K/in) times rod position change (in) or reactivity (ΔK/K). Plot the hatched area, integral worth, versus rod position as in Figure 7.2.a to obtain the first point on the integral worth curve.
Move up another inch of rod position and find a rectangular area which represents the true area under the differential curve between the preceding position and the present position as shown on Figure 7.2.b. The integral worth at this position is the area just determined plus all of the preceding areas, in other words, the total area under the differential curve up to that position. Plot the cumulative area versus rod position as another point on the integral worth curve.
Continue the evaluation and summation of areas as shown in Figures 7.2.c and 7.2.d over the entire length of the rod. The final integral worth curve is shown in Figure 7.2.d. The left curve has rod position as its vertical axis just as it is in the core. The right curve has rod position in the more traditional horizontal position.
The reactivity change in moving the rod from position 1 to position 2 is the integral worth at position 2 minus the integral worth at position 1. The integral rod worth curve in Figure 7.2 was plotted, starting with zero reactivity when the rod is on the bottom and positive reactivity being added as the rod is withdrawn. It could just as well have been plotted with zero integral worth at the top and negative reactivity added as the rod is inserted.
The integral rod worth curve is S shaped. As the rod is withdrawn from the low flux bottom of the core, cumulative reactivity is added slowly. Reactivity is added rapidly at midcore where flux is highest. As the rod is withdrawn toward the top of the core, the slope of the curve diminishes again because the rate of reactivity addition tapers off.
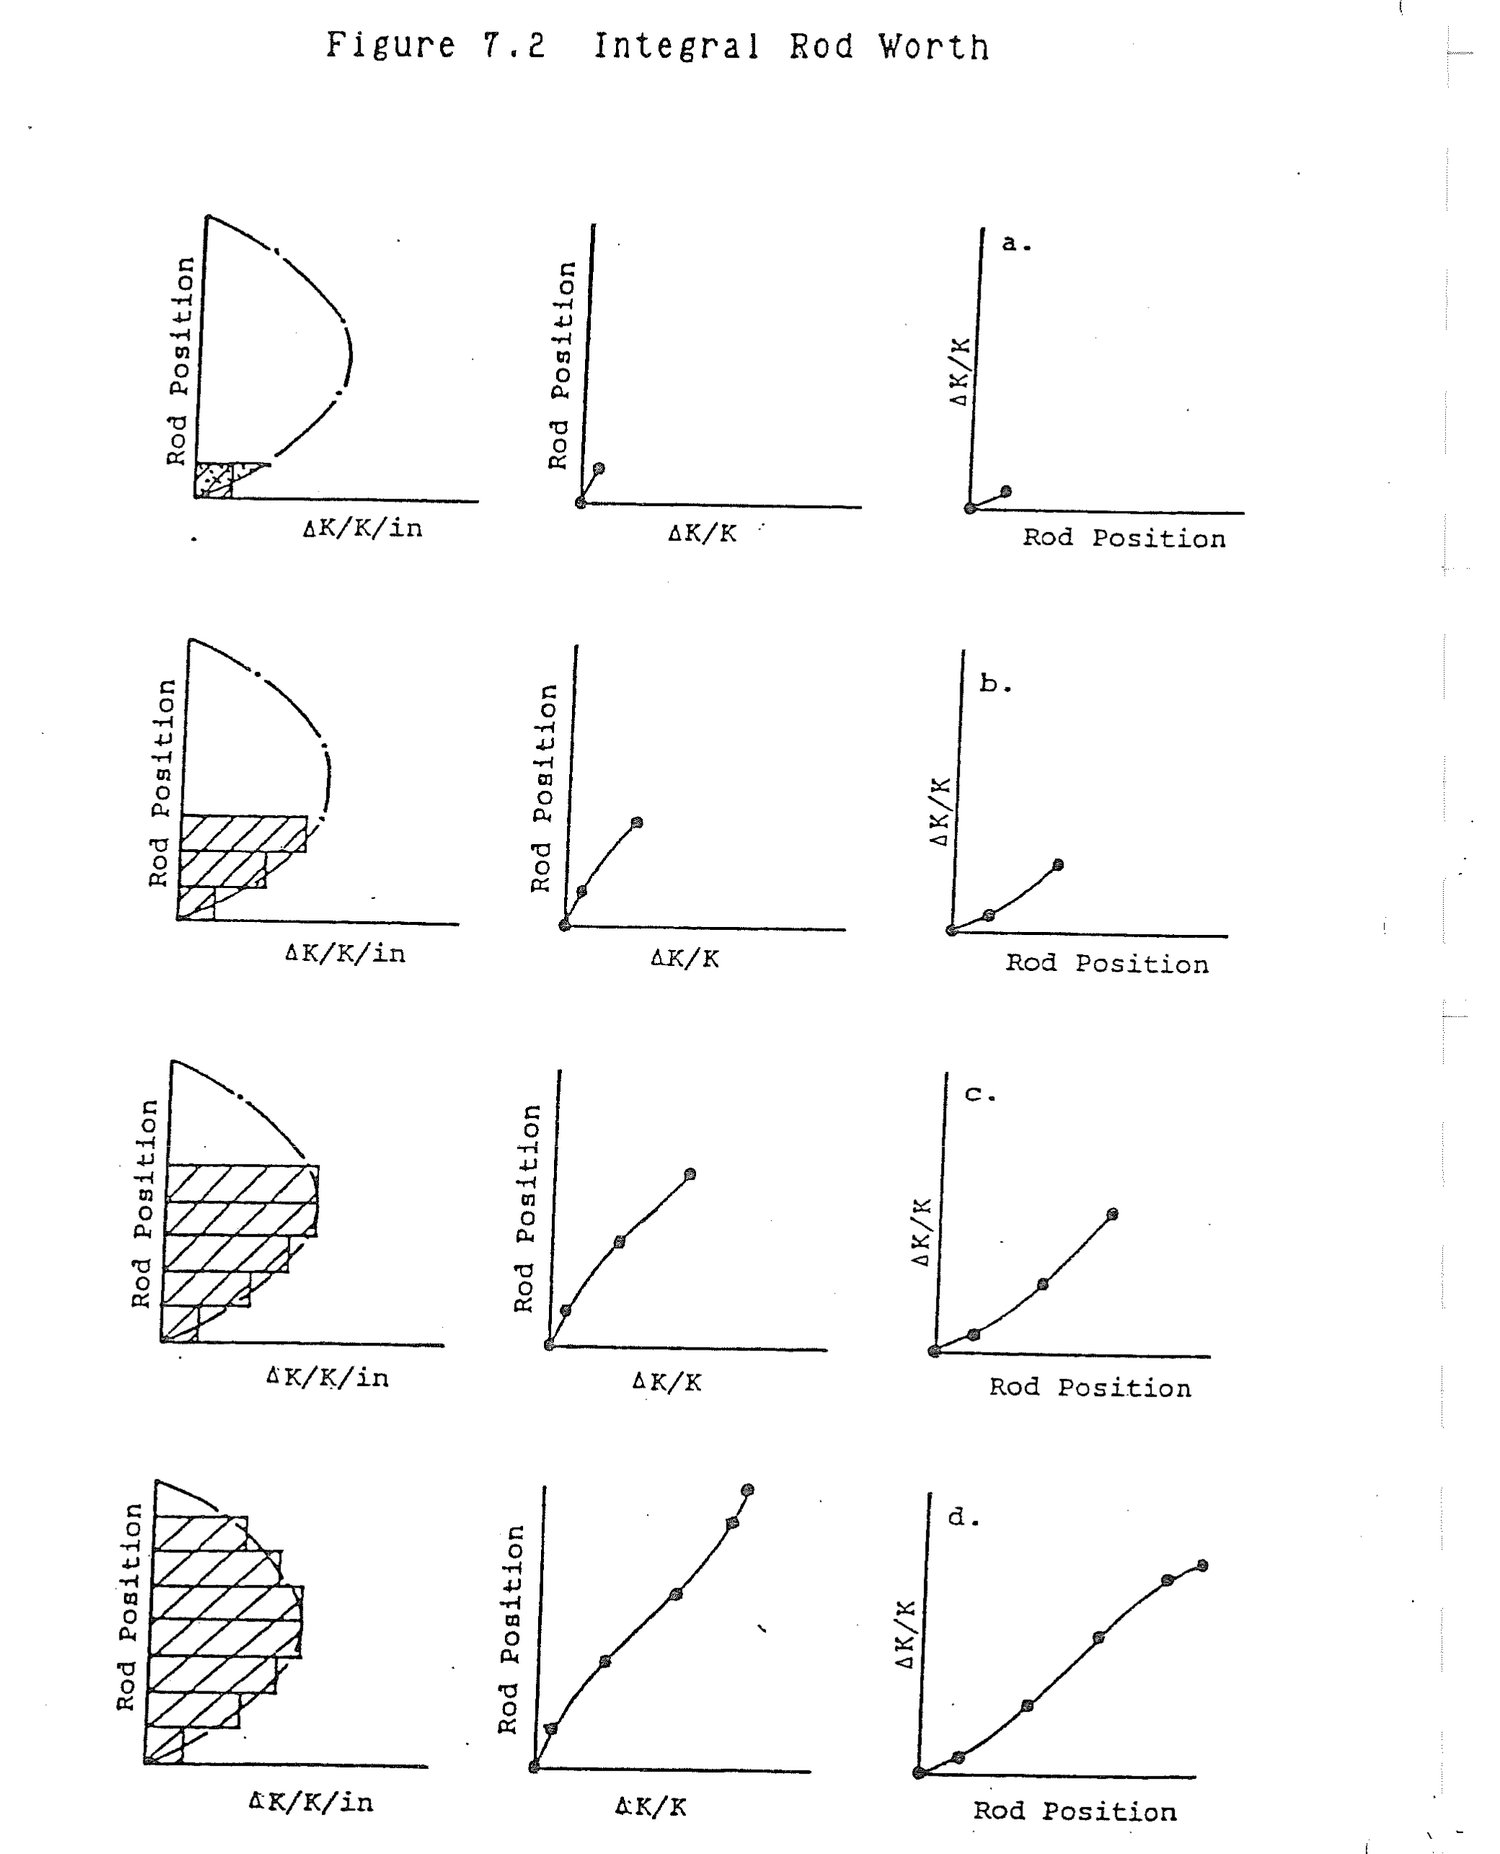
Figures 7.3 and 7.4 are typical idealized differential and integral rod worth curves for a single rod.
Why is the integral rod worth curve so named?
The integral worth curve represents the cumulative area under the differential curve starting from the bottom of the core. Calculation of the area under the differential curve is integration of the curve.
Describe the shape of the integral rod worth curve.
The curve is S shaped. It increases slowly at the bottom of the core where the area under the differential curve is small. Toward the middle of the core, the curve increases at its greatest rate (steepest slope) because the area under the differential curve is greatest. The curve continues to increase to the top of the core, but once again the rate of increase decreases because the differential curve area tapers off.
The following data was collected during a control rod worth determination for a twelve foot control rod. At each step, the reactor starts at critical, steady state and the reactivity added is from the rod alone.
Control Rod Motion Reactor Doubling Time, td
(ft) (sec)
0-3 101
3-4.5 82
4.5-6 78
6-7.5 89
7.5-9 131
9-12 166
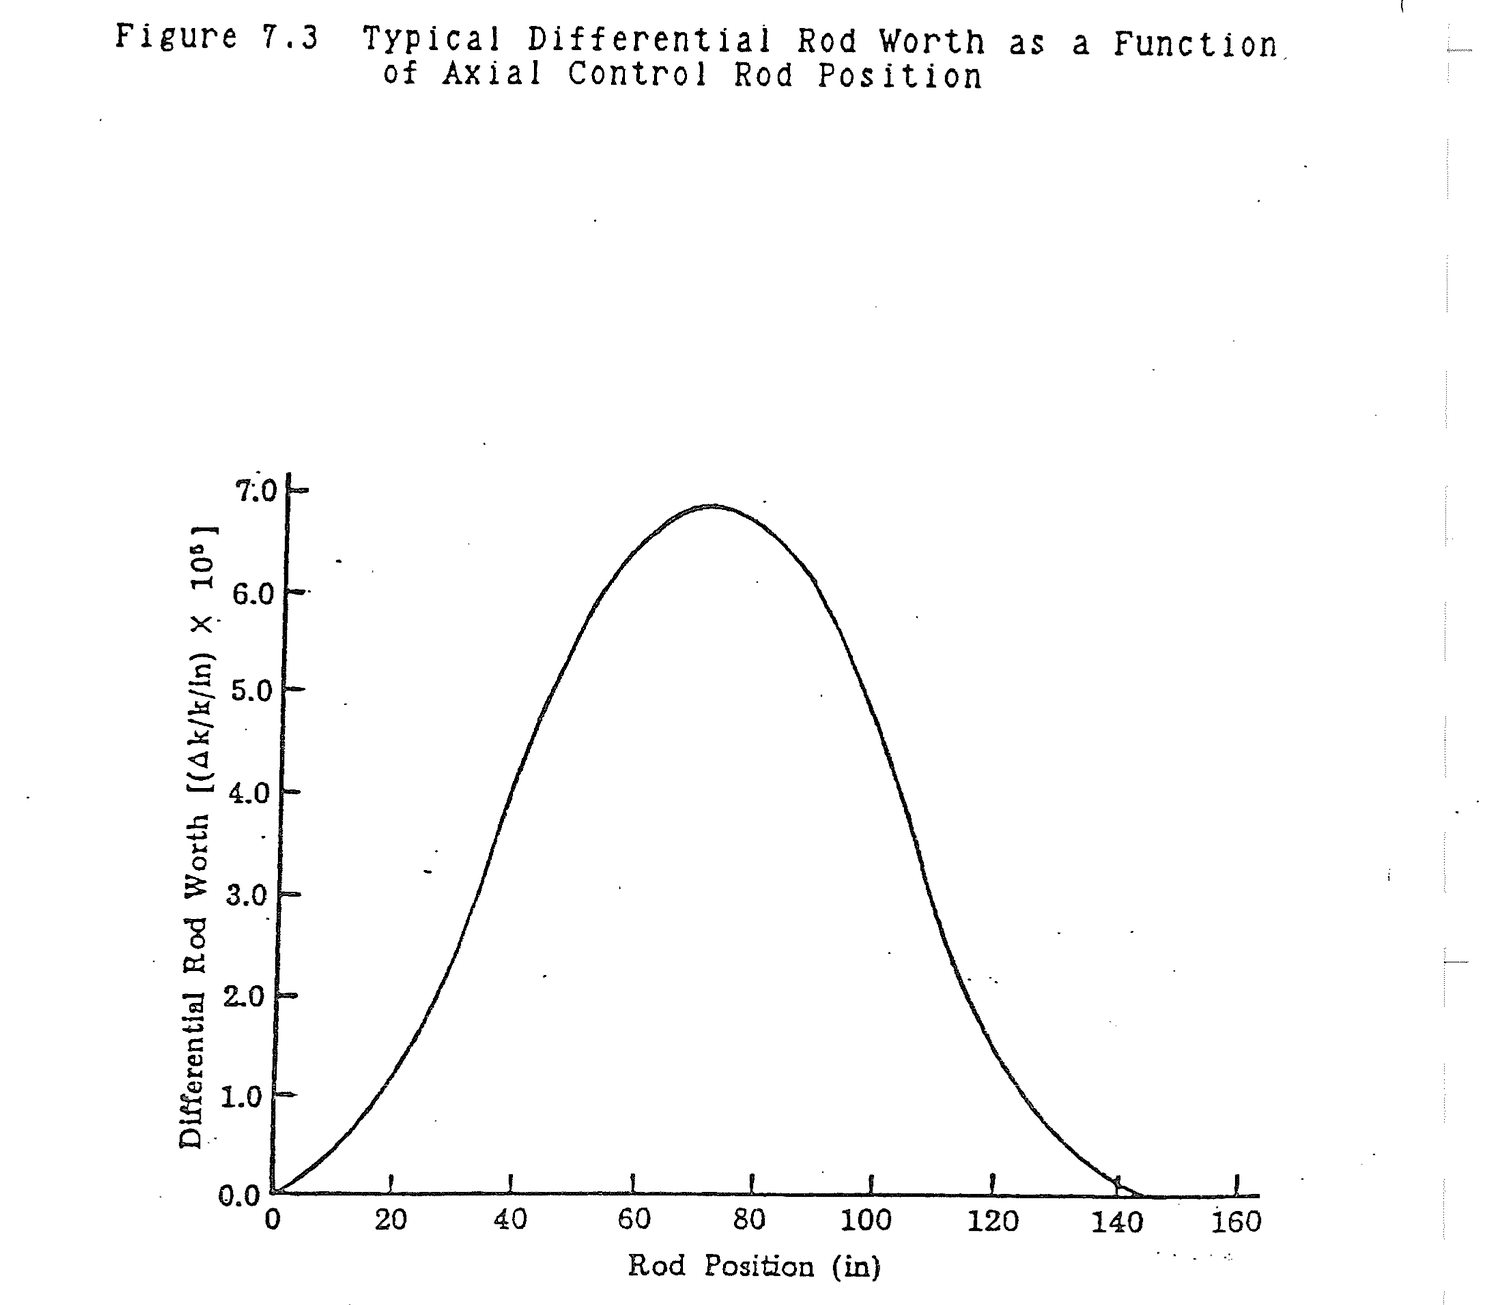
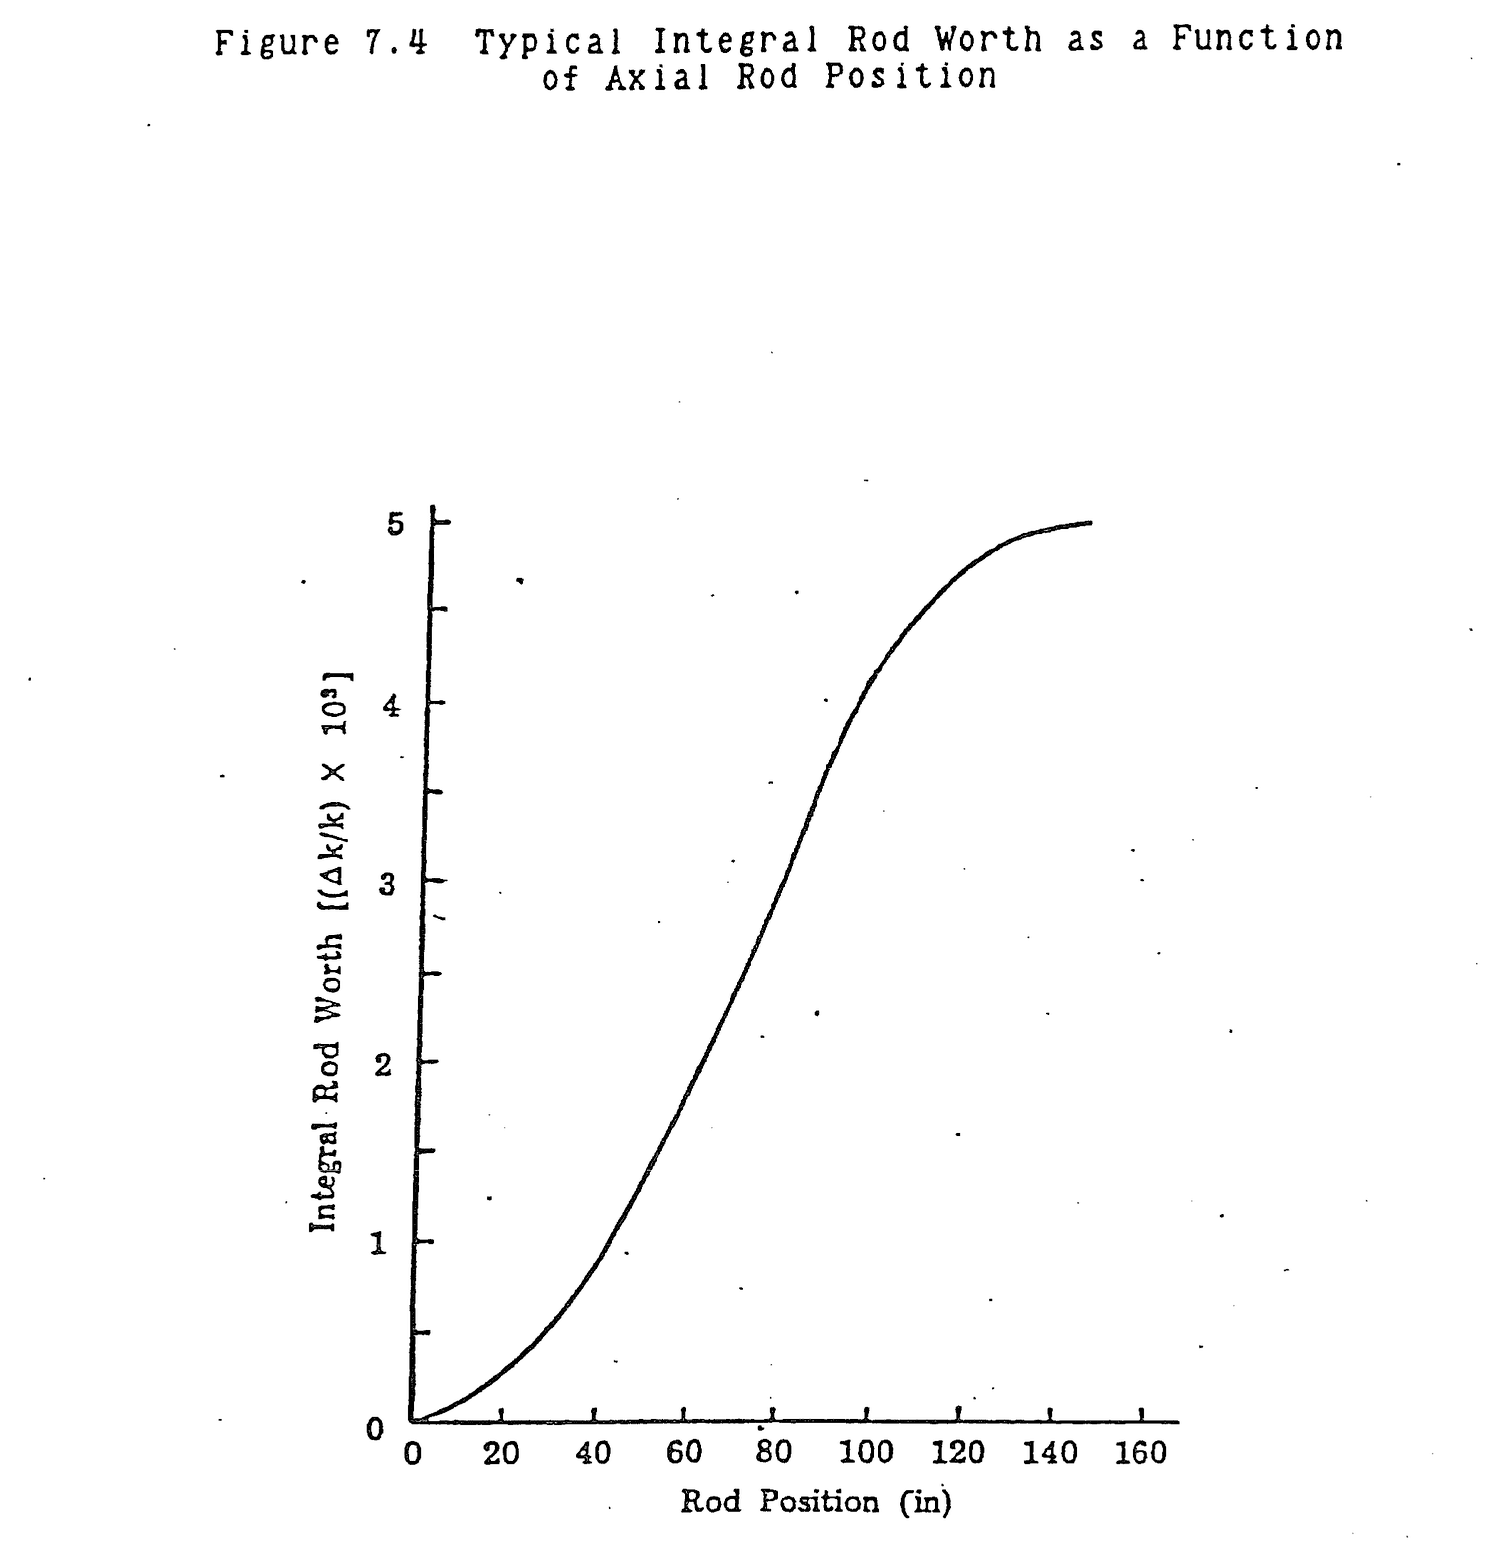
Determine the integral rod worth.
T=td/ ρ=β/ Integral Rod Rod Motion td .693 (1+λT) Σρ Position (ft) (sec) (sec) (ΔK/K) (ΔK/K) (ft) ---- ----- ----- ------ ------ ---- 0-3 101 146 4.8x10⁻⁴ .48x10-3 3 3-4.5 82 119 5.8x10⁻⁴ 1.06x10⁻³ 4.5 4.5-6 78 113 6.1x10⁻⁴ 1.67x10⁻³ 6 6-7.5 89 129 5.4x10⁻⁴ 2.21x10⁻³ 7.5 7.5-9 131 188 3.8x10⁻⁴ 2.59x10⁻³ 9 9-12 166 240 3.0x10⁻⁴ 2.89x10⁻³ 12
In order to operate a reactor, there must be sufficient control to shut the reactor down, even if the most reactive rod is inoperative and withdrawn from the core. This is known as the one stuck rod criterion. Specifically, the reactor must have a 0.0045 ΔK/K (0.45% ΔK/K) shutdown margin with the most reactive rod withdrawn from the core. The shutdown margin with all rods inserted is 0.025 ΔK/K (2.5% ΔK/K).
Maximum rod drive speed is intended to limit the rate at which rods can be withdrawn during a reactor startup. A high rate of positive reactivity addition could result in the reactor becoming supercritical on a short period when low flux levels give erratic instrument readings. By the time the flux level is great enough to give reliable power level readings and respond to the short period, reactor power may be increasing too fast to prevent overheating and core damage. Another consideration is that the rate of reactivity addition by the rods must be sufficient to overcome xenon reactivity transients. In particular, the rods must be able to add negative reactivity faster than the positive reactivity that would result from xenon burnout following a startup to full power at peak xenon.
Describe the bases for limits on:
(a) Rod speed;
(b) Rod configuration.
(a) Override positive reactivity due to xenon burnout; Prevent prompt criticality by rod withdrawal; Prevent accident causing reactivity insertions (e.g., short period in the source range).
(b) Axial and radial flux shaping; Prevent axial and radial power peaking; Provide adequate shutdown margin.
A reactor is critical at low power. The integral reactivity of a bank of rods is 1.2 %ΔK/K; rod bank worth is linear over its 12 ft length. The bank is withdrawn 12 inches at a speed of 1.2 in/sec.
(a) When is the period minimum?
(b) Calculate the minimum period.
(c) Calculate the final stable period.
(a) Minimum period occurs just before rod motion is stopped; when the total reactivity has been added and the rod is still in motion.
(b) ρdiff = (0.012 ΔK/K)/(12 ft)
= 0.001 ΔK/K/ft
= 0.000083 ΔK/K/in
ρ = ρdiffL
= (0.001 ΔK/K/ft)(1 ft)
= 0.001 ΔK/K
Δρ/Δt = ρdiff Rod Speed
= (0.000083 ΔK/K/in)(1.2 in/sec)
= 0.0001 ΔK/K/sec
T = (β-ρ)/(λρ+Δρ/Δt)
= (0.0075-0.001)/((0.1)(0.001)+0.0001)
= 32.5 sec
(c) T = (β-ρ)/λρ
= (0.0075-0.001)/(0.1)(0.001)
= 65 sec
Rod shadow is an effect in which the repositioning of one control rod changes the reactivity worth of adjacent rods or causes a change in power level indication on neutron detectors when power level has remained constant. Rod shadow is caused by flux redistributions within the core as a result of rod motion.
Two illustrations of the rod shadow effect are shown in Figures 7.5 and 7.6. In Figure 7.5, rod A has been moved out of the core. In order to accomplish this while maintaining power level constant, other rods must be inserted slightly. A constant or isoflux line is shown. As a result of rod A withdrawal, the isoflux line shifts upward so that rod B is in an overall higher flux. When rod B is moved, it cuts through a higher overall flux so it is more reactive. Rod B reactivity has increased due to the repositioning of rod A.
In Figure 7.6, an isoflux line is shown early in core life. As xenon builds up in the reactor, the rods are withdrawn to compensate. Rod withdrawal causes the isoflux line to shift upward in the core even though reactor power remains constant. Essentially, this means that a larger fraction of total power is
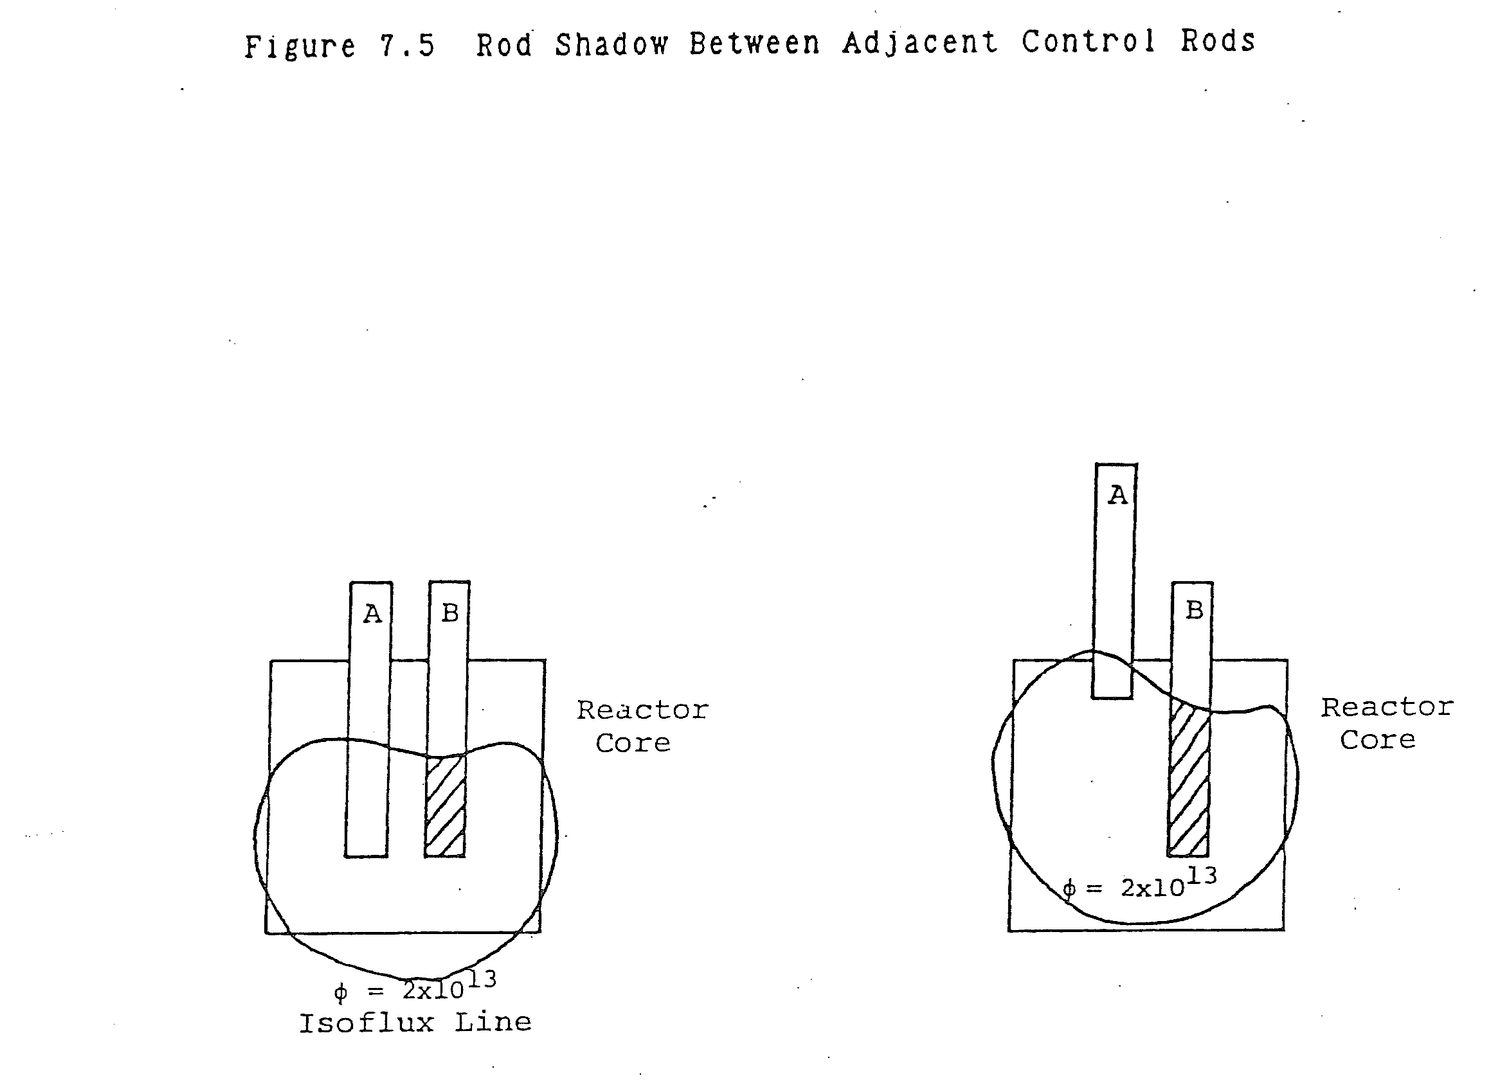
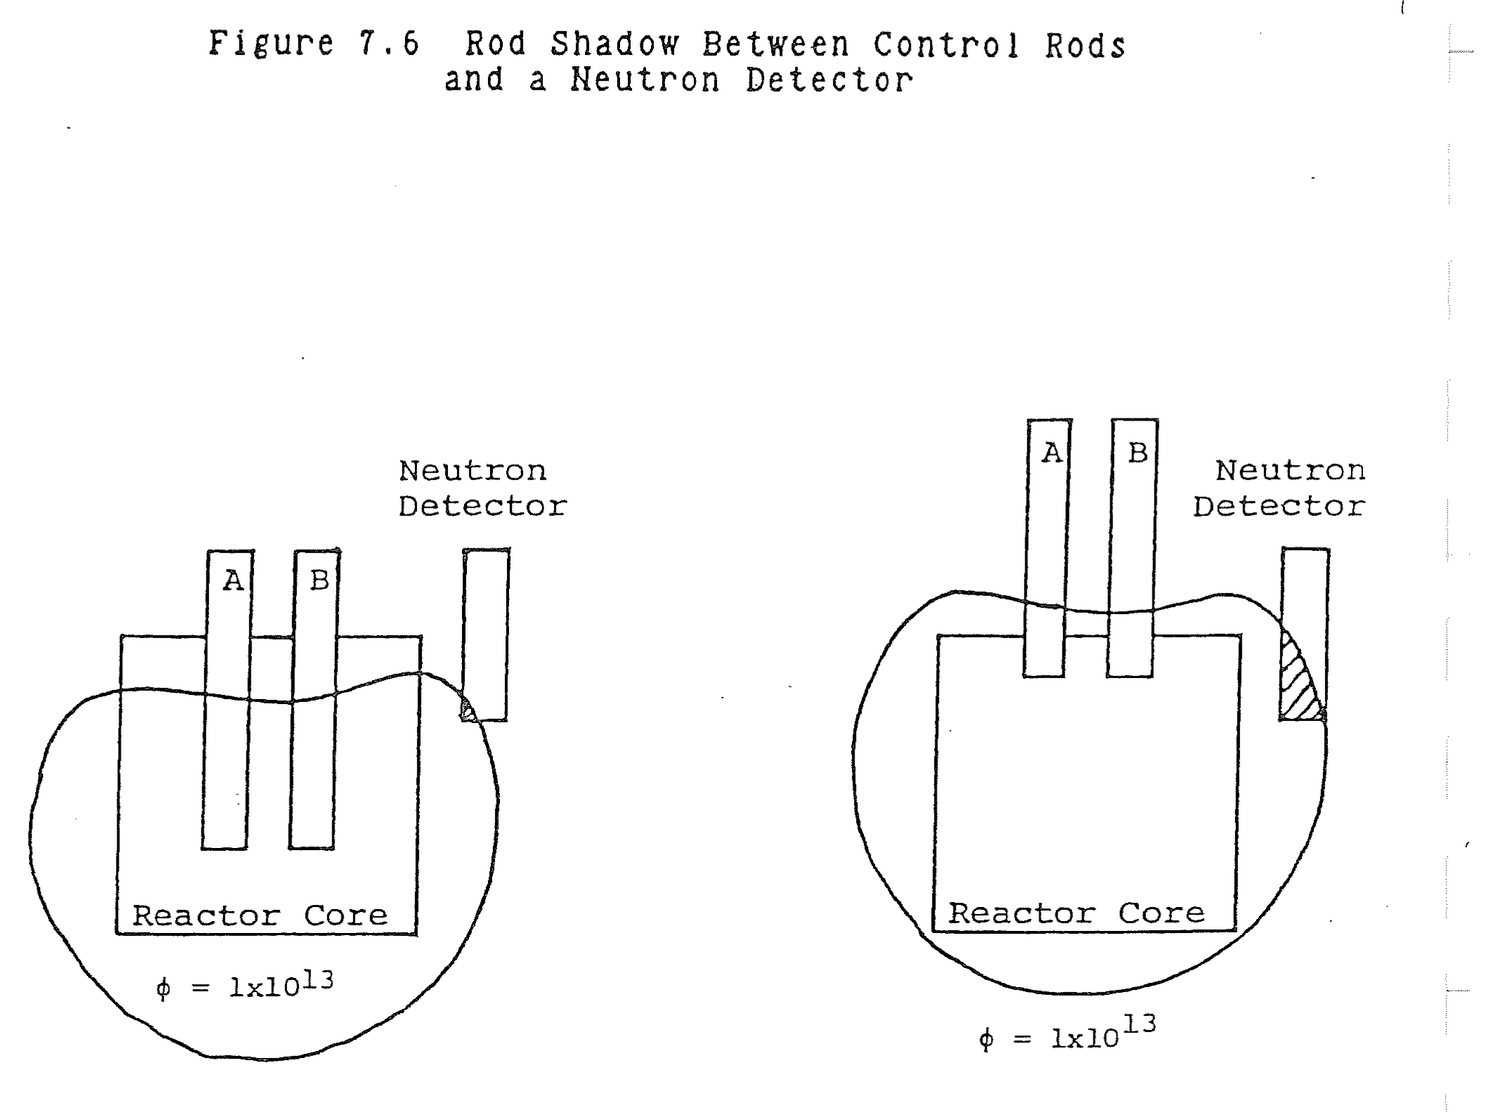
being generated in the upper portion of the core. The neutron detector, located in the upper portion of the core, sees an increased flux while overall power level has remained constant.
Define rod shadow.
Rod shadow is an effect in which the repositioning of one control rod changes the reactivity worth of adjacent rods or causes a change in indicated power when actual power level has not changed.
What causes rod shadow?
Redistribution of flux levels within a core due to rod repositioning.
The worth of a control rod is a direct function of the thermal neutron flux to which it is exposed and to the thermal diffusion length. It is inversely proportional to effective core size.
Control rods at the center of the core are exposed to a higher thermal flux than those at the core periphery and, therefore, have a greater worth. It is possible for a thermal flux peak to exist anywhere radially within the core which would increase the worth of a rod within that flux peak even if the rod were near the edge of the core. Generally, any parameter change within the core that changes thermal neutron flux will change rod worth.
As moderator temperature increases, moderator density decreases. Neutrons travel a greater distance in thermally diffusing and are more likely to come in contact with and be absorbed in control rods. Thus, rod worth increases with moderator temperature increase.
7.7.1 (a) Sketch and label a differential control rod worth curve.
(b) Sketch and label an integral control rod worth curve.
Solution:
(a) Figure 7.3
(b) Figure 7.4
7.7.2 Through circumstances due to experimental loading and xenon concentration, the differential rod worth of particular rods at a particular time are found to be of the shape:
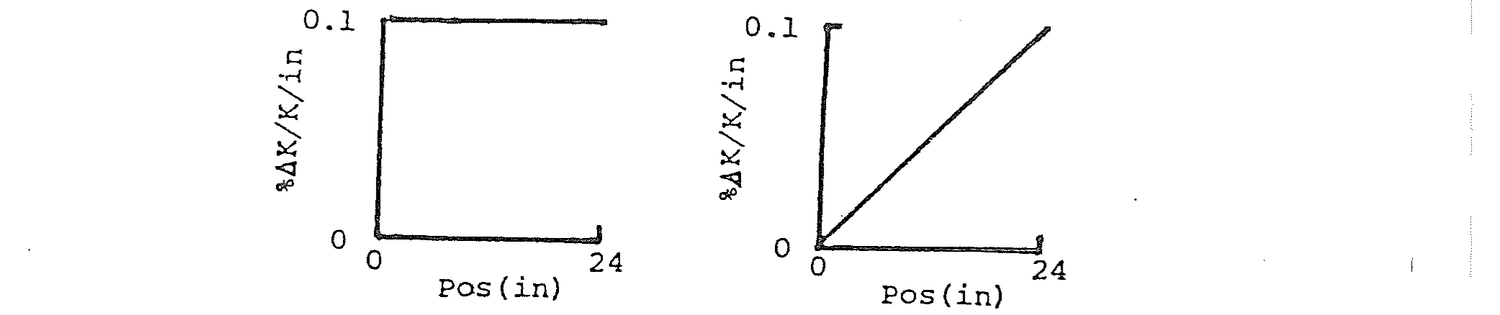

(a) Sketch the general shape of each resulting integral rod worth curve.
(b) What is the total rod worth?
Solution:
(a)


(b) 2.4 %ΔK/K and 1.2 %ΔK/K
7.7.3 During the testing of a reactor core, it has become apparent that a change is necessary. The center rod is too strong. One engineer wants to replace it with a rod that contains less poison. A second engineer states that a rod located near the edge of the core (identical to the center rod) doesn't effect reactivity as much as the center rod and suggests using that rod in the center. The first engineer rejects this idea. Why?
Solution:
The rod near the edge of the core is in a lower flux so the number of poison neutron interactions is fewer. If moved to the center of the core, this rod would be as reactive as the rod currently in the center of the core.
7.7.4 What movement of rods will be required to maintain constant reactor power as a result of the following changes?
(a) Samarium buildup;
(b) Pool water temperature decrease;
(c) N-16 formation;
(d) U-235 burnup;
(e) Xe-135 buildup.
Solution:
(a) Rods withdraw;
(b) Rods insert;
(c) None;
(d) Rods withdraw;
(e) Rods withdraw.
7.7.5 Rod speeds are limited to low values to avoid reactivity insertion at too great a rate. What hazard does a fast reactivity insertion rate present during startup?
Solution:
If rod speeds were too fast, the reactor could be placed on a short period such that as power exceeded a trip level, the safety system would not act fast enough to turn power before core damage was done.
7.7.6 Does rod worth vary if another rod is placed adjacent to it? Explain.
Solution:
Any object placed in the core that changes the flux profile near a rod will cause the rod worth to vary. If the neutron flux is lowered the rod worth will go down.
7.7.7 Discuss briefly, why reactivity worth of an individual rod can be variable throughout operation in a cycle. Include both radial and axial effects in discussion. Assume constant boron content.
Solution:
Rod worths depend on neutron flux. As neutron flux around the rods changes, rod worth will change. As rods are moved from one flux to another, rod worth will change.
The radial effect on rod worths is to fuel burnup and xenon buildup. Fuel burnup causes the radial flux profile to flatten in the center, thereby changing the neutron flux around the rods. Rod worth becomes less in the center of the core and it increases at the edges. The axial effect on rod worths is due to the raising of rods throughout the cycle to compensate for xenon and burnup. As the rods are withdrawn from the core, less of each rod is surrounded by fuel so there are fewer neutron available for the rods to absorb. Because the rods are in a lower flux, their worths will be less.
7.7.8 Explain the rod shadow effect and what this means to reactor operation in terms of effects on rod worths and detector power level indication.
Solution:
Rod shadow is the shifting in the spherical isoflux lines in and around the reactor core by rod motion. It can cause a change in the reactivity worth of nearby rods by changing the flux patterns cutting those rods. It can also cause a change in indicated reactor power with no change in actual power by shifting flux patterns around detectors.
7.7.9 Would control rod worth be greater:
(a) When the moderator is at 150 F or 500 F;
(b) When it is next to a withdrawn control rod or surrounded by inserted control rods;
(c) For a rod in the center of the core or at the outside of the core?
Explain your answers.
7.7.10 While subcritical and withdrawing control rods, the operator observes a significant change in count rate while withdrawing a peripheral rod. The next rod he moves in the center of core, shows little change in multiplication. Is this an abnormal condition? Explain your answer.
7.7.11 (a) What data is taken in order to generate a control rod differential rod worth curve? Be specific on method used and readings/measurements taken.
(b) How is the above data converted to the final information to plot the curve?
7.7.12 (a) What are 2 factors which determine rod worth?
(b) What are 2 factors which affect rod worth?
Solution:
(a) Poison loading and cross section; neutron flux pattern.
(b) Adjacent rods; moderator temperature; void fraction; core age.
This page of the original is blank apart from its running header and page label.
Two fission fragments are produced in every fission. Some of these nuclei and their progeny have substantial neutron absorption cross sections. Their appearance in the reactor tends to reduce the multiplication factor. For that reason, these nuclei are known as fission product poisons.
Most fission products have low absorption cross sections, but there are important exceptions. Table 8.1 lists the fission yields, including formation by decay of other isotopes, and absorption cross sections of the eight isotopes with the largest known neutron absorption cross sections. The table shows that xenon-135 and samarium-149 have fission yields large enough to have a significant effect on reactor operation.
As xenon-135 and samarium-149 are formed in a reactor, they reduce the multiplication factor by decreasing the thermal utilization factor, f. Since the formation of fission product poisons is a direct function of the fission rate, as power level changes the amount of poison present in the reactor also changes. Control system reactivity insertions such as rod motion and chemical shim must be made to compensate for fission product reactivity.
What are the three most troublesome reactor fission products as a result of their effect on reactor power?
Xe135.
I135, the major source of Xe135 with an absorption cross section of 2.7x10⁶ barns.
Pm149, the source of Sm149 with a 4.2x10⁴ barn cross section.
After studying the lesson material and working exercise problems, the student should be able to:
1. Explain the dependence of equilibrium xenon and samarium on core neutron flux.
2. Describe the equilibrium xenon and samarium balance in a reactor.
Table 8.1 Uranium-235 Fission Product Poisons
Percent Yield as Fission
Absorption Cross Products and by Fission
Isotope Section (barns) Product Decay (%)
Xe-135 2.7x10⁶ 6.4
Gd-157 2.5x10⁵ ≈1x10⁻²
Gd-155 6.1x10⁴ ≈8x10⁻²
Sm-149 4.2x10⁴ 1.1
Cd-113 2.0x10⁴ ≈1x10⁻²
Sm-151 1.0x10⁴ ≈6x10⁻¹
Eu-151 7.7x10³ ≈6x10⁻¹
B-10 3.8x10³ <1x10⁻⁴
3. Describe xenon and samarium transient behavior for the following power histories: (1) startup to steady state power; (2) shutdown from steady state; (3) startup near peak shutdown concentration; (4) decrease in power after prolonged operation at steady state; and (5) increase in power after prolonged operation at steady state.
4. List typical xenon and samarium time parameters including time to reach equilibrium and time to reach peak after shutdown.
The most important fission product poison is xenon-135. Xenon-135 is formed directly as a fission product and by decay of iodine-135. Xenon-135 is lost by radioactive decay and by neutron absorption to become xenon-136 which is called burnout. Xenon balance in the reactor is illustrated in Figure 8.1. Since iodine-135 decays to become xenon-135, its balance in the reactor must also be considered. Iodine-135 is formed by decay of tellurium-135 and as a fission product and, in turn, decays to become xenon-135. The half life of tellurium-135 is 19 seconds in comparison to 6.7 hours for iodine-135. For all practical purposes it can be assumed that all iodine-135 is formed directly by fission. For this reason a fission product yield fraction for iodine-135, yI, is given in Table 8.2 when tellurium-135 is, in fact, the fission product. Tables 8.2 and 8.3 provide fission product yields, half-lives, and decay constants for those isotopes involved with fission product poisoning.
Describe the xenon balance in a reactor.
Figure 8.1
Xe135 is formed by fission and I135 decay.
Xe135 is lost by decay and neutron absorption.
I135 is formed by fission.
I135 is lost by decay to Xe135.
Table 8.2 Fission Product Yields in Atoms per Fission for I135(yI), Xe(yX), and Pm149(yp) from Thermal Fission
Isotope U233 U235 Pu239 I135 0.051 0.061 0.055 Xe135 --- 0.003 --- Pm149 0.0066 0.0113 0.019
Table 8.3 Half-Lives and Decay Constants for Fission Product Poisoning Calculations
Isotope T2 (hr) λ(sec-1) λ(hr-1) I135 6.7 2.87 x 10⁻⁵ 0.1035 Xe135 9.2 2.09 x 10⁻⁵ 0.0753 Pm149 54.1 3.56 x 10⁻⁶ 0.0128

The time rates of change of xenon and iodine in the core can be established by mathematically representing the xenon balance given in Figure 8.1
dX/dt = γXΣfφ + λII - λXX - XσXφ (8.1) dI/dt = γIΣfφ - λII (8.2)
where:
X = Xenon number density, atoms/cm3;
I = Iodine number density, atoms/cm3.
Note the similarity between these equations and the equations for radioactive decay, neutron activation, and power change. We would expect the solutions for X and I to be exponentials. The solutions should be most similar to neutron activation because equation (8.2) is nearly identical in form to the activation equation. Thus xenon and iodine concentrations start at zero and build up exponentially to equilibrium values.
Note the coupling between the two equations. Decay of iodine, λII, in (8.2) produces xenon in (8.1). The 6.7 hour iodine half-life is the controlling time constant for reaching equilibrium. After seven iodine half-lives or 46.9 hours, xenon and iodine will have exceeded 99% of their final equilibrium values. Plots of xenon buildup to equilibrium for reactor fluxes of 1x10¹³, 5x10¹³, 1x10¹⁴, and 5x10¹⁴ n/cm2/sec are shown in Figure 8.2. The time to reach equilibrium is typically rounded off to 48 hours or two days.
Equilibrium xenon and iodine number densities are calculated from equations (8.1) and (8.2) by setting dX/dt and dI/dt equal to zero. Solve (8.2) for I.
I = γIΣfφ/λI (8.3)
Substitute equation (8.3) in equation (8.1) to calcualte equilibrium xenon concentration.
0 = γXΣfφ + γIΣfφ - λXX - XσXφ (8.4)
Solve (8.19) for X.
X = ((γX+γI)Σfφ)/(λX + σXφ) (8.5)
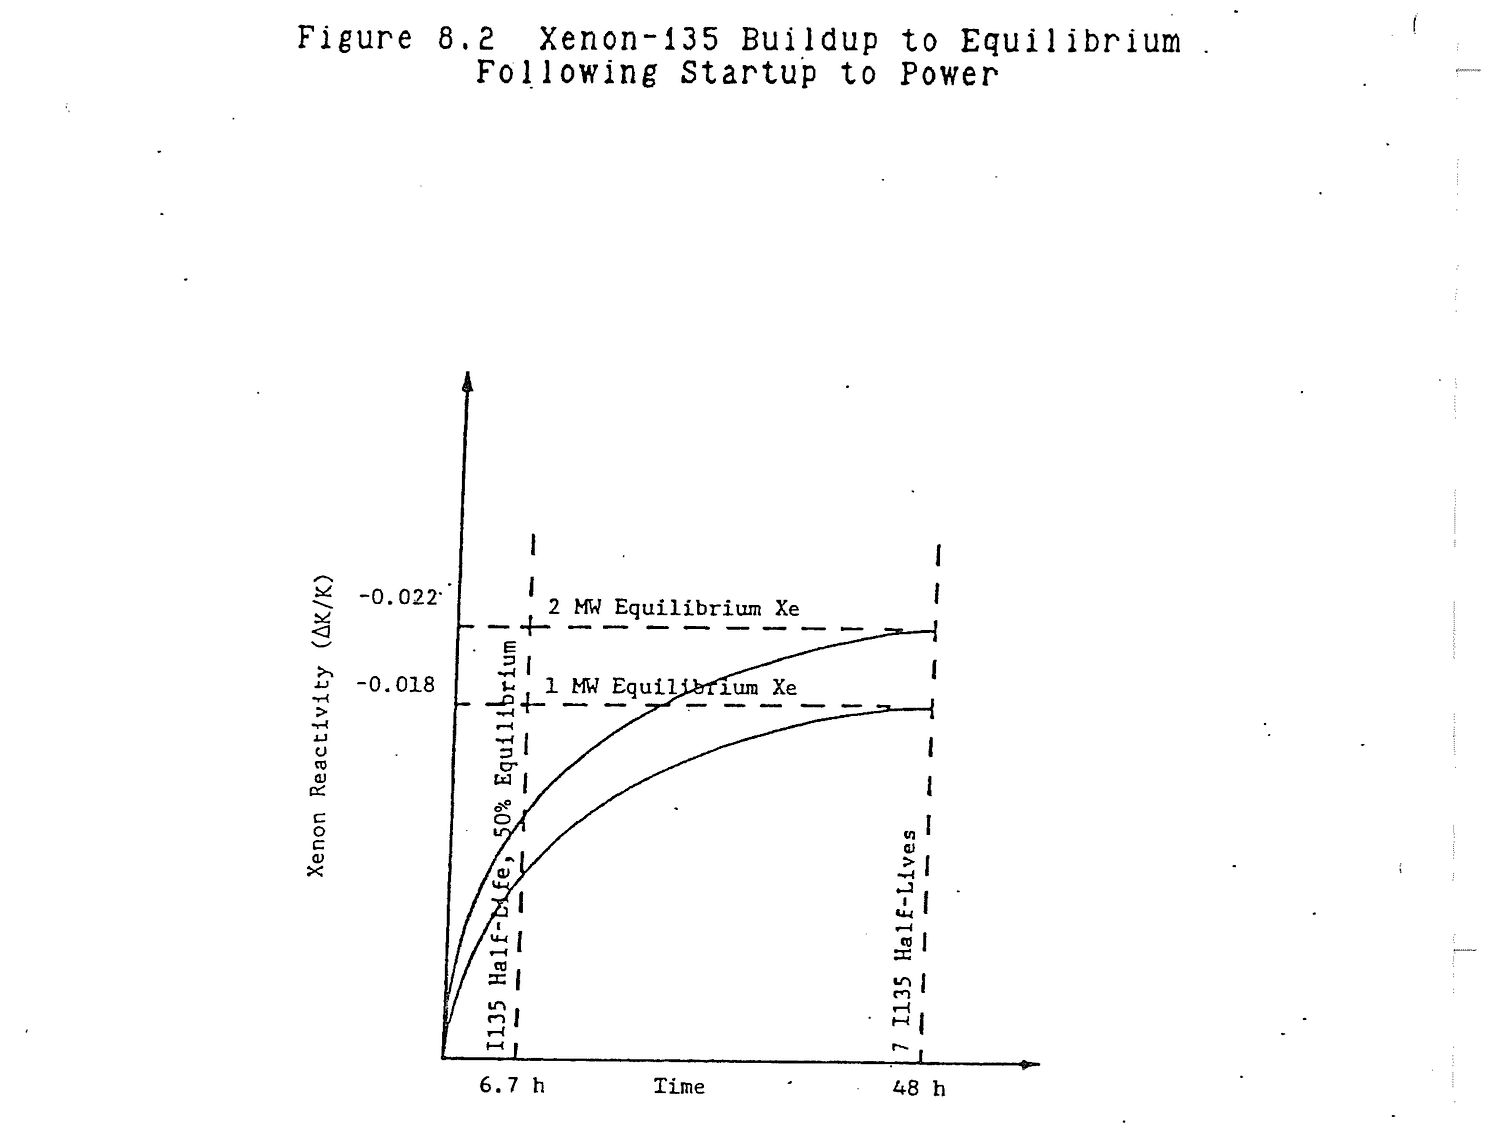
Equilibrium iodine is linearly dependent on flux. Equilibrium xenon is flux dependent, but the dependence is not linear because flux appears in both the numerator and denominator of equation (8.5).
Of greater interest from an operational point of view is xenon reactivity, ρX, which is shown on Figure 8.2 for one and two megawatt operation.
Derive the equation for equilibrium xenon.
dX/dt = 0 = γXΣfφ + λII - λXX - XσXφ
dI/dt = 0 = γIΣfφ - λII
0 = γXΣfφ + γIΣfφ - λXX - XσXφ
X(λX+σXφ) = (γX+γI)Σfφ
X = (γX+γI)Σfφ/λX+σXφ
Is equilibrium xenon flux dependent?
Yes, but not linearly dependent on flux.
When a reactor is shutdown, the neutron flux decreases to a low level which can be treated as if it were zero. In the xenon balance in Figure 8.1, the fission yields and burnout decrease to near zero. Xenon is produced only by iodine decay and depleted only by its own radioactive decay. The iodine which decays to become xenon is an amount that built up within the reactor during operation, so it is dependent upon past power history and neutron flux. After 48 hours of steady state reactor operation, the amount of iodine present in the reactor is I in equation (8.3). Equations (8.1) and (8.2) become:
dX/dt = λII-λXX (8.6) dI/dt = -λII (8.7)
If the iodine concentration at shutdown is I, equation (8.7), is identical to the equation for radioactive decay. The solution to the equation and the iodine concentration at any time, t, after shutdown is:
I(t) = Ie-λIt (8.8)
Equation (8.8) shows that, after reactor shutdown, all I135 in the reactor core decays to produce Xe135. Since the half-life of I135 is shorter than the half-life of Xe135, xenon will be produced more rapidly than it decays. As shown in Figure 8.3, xenon concentration in the core will peak at a time, tpk, when the iodine has depleted to the point where the iodine decay rate in equation (8.6) just matches the xenon decay rate. After that time the rate of xenon decay exceeds the rate of production by iodine decay and the xenon concentration in the core will decrease.
For two megawatt operation, peak xenon occurs approximately 7 hours after shutdown. Peak xenon reactivity is about -0.031 ΔK/K which is 0.009 ΔK/K greater than the equilibrium value.
Two other parameters are shown in Figure 8.3. The first is the time from shutdown to the point where xenon has peaked and decayed back to the starting equilibrium level. This time, td, is approximately 18 hours.
The second time is the approximate time after shutdown, tc, for xenon to decay away to provide a clean, xenon free core. The value is approximately tpk + 7(T2 Xe135). This assumes that, past the peak, depletion of xenon is strictly by decay, which is not completely true because a diminishing quantity of iodine always remains to produce some new xenon. An approximate time for tc after shutdown is 72 hours.
What happens to xenon following a reactor shutdown?
Xenon builds up to a peak due to I135 decay that is dependent upon operating power. Gradually the I135 depletes such that Xe135 decays at a faster rate than I135 produces Xe135 so the peak decays eventually to zero.
If sufficient excess core reactivity is available to overcome the negative reactivity inserted by xenon following a shutdown, the reactor can be started up. At the time of startup, the reactor is in a somewhat depleted iodine condition so xenon formation by iodine decay is below equilibrium rates. However, if power level is returned to the preshutdown level, full neutron flux exists and xenon is burned out by neutron capture at its maximum rate. The result is a rapid drop in xenon concentration and reactivity as shown in Figure 8.4. The increased power also
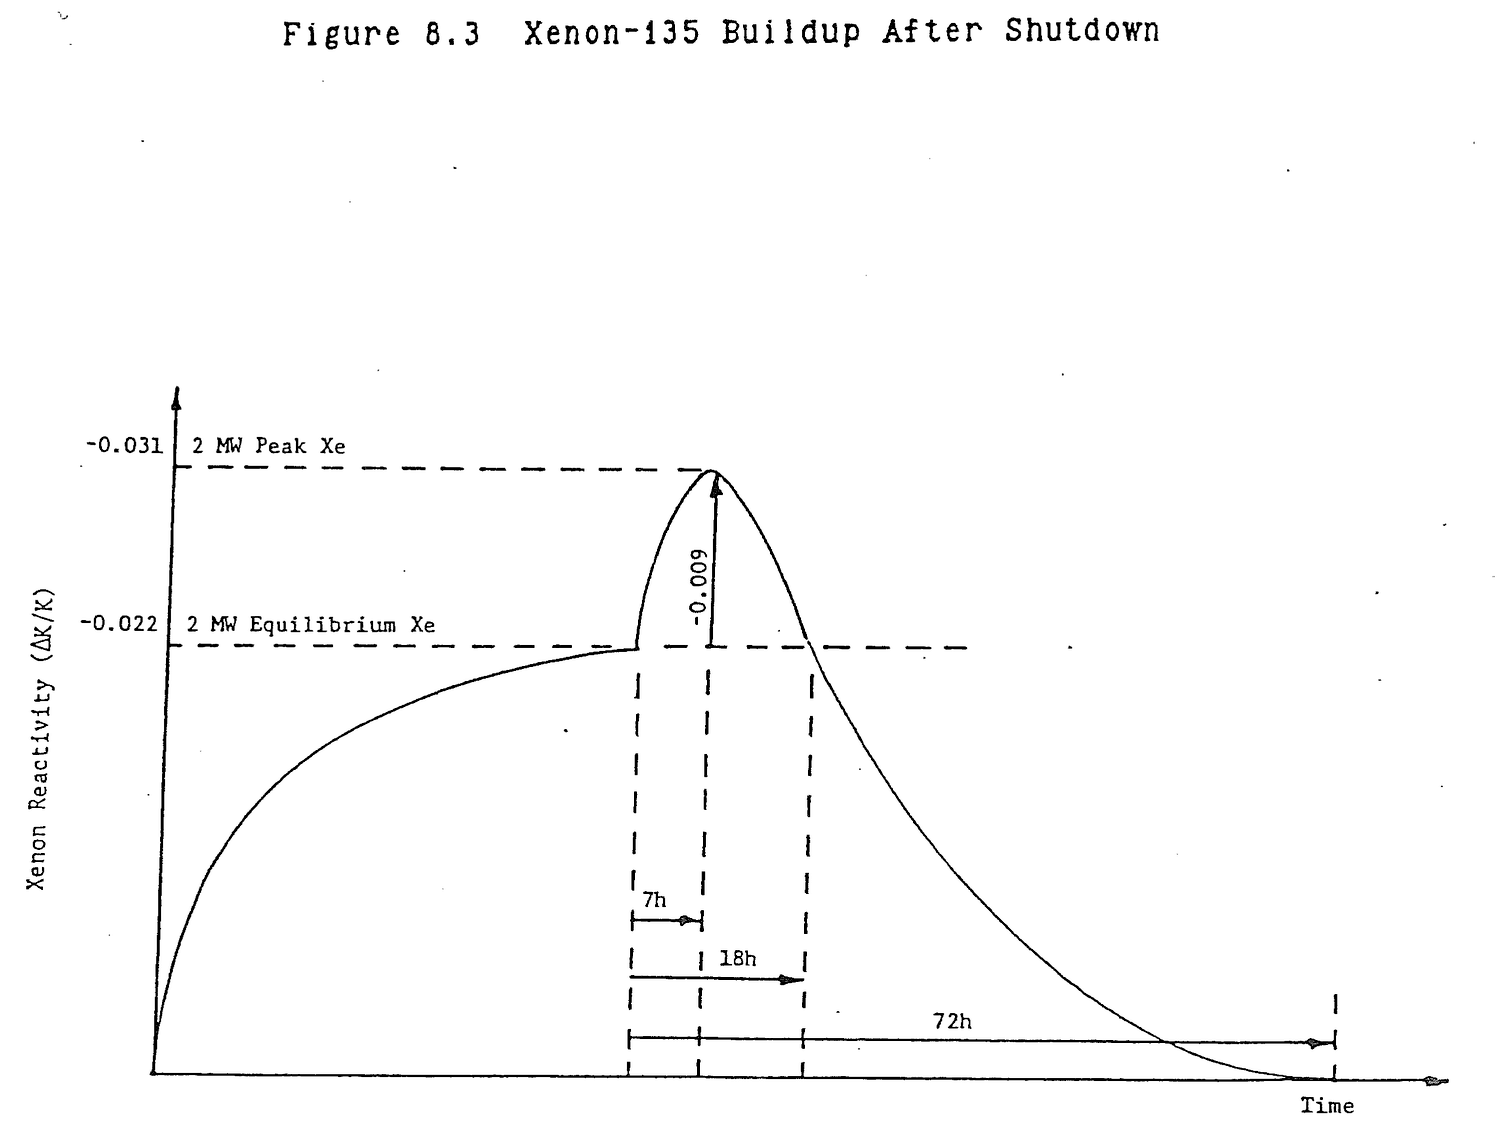
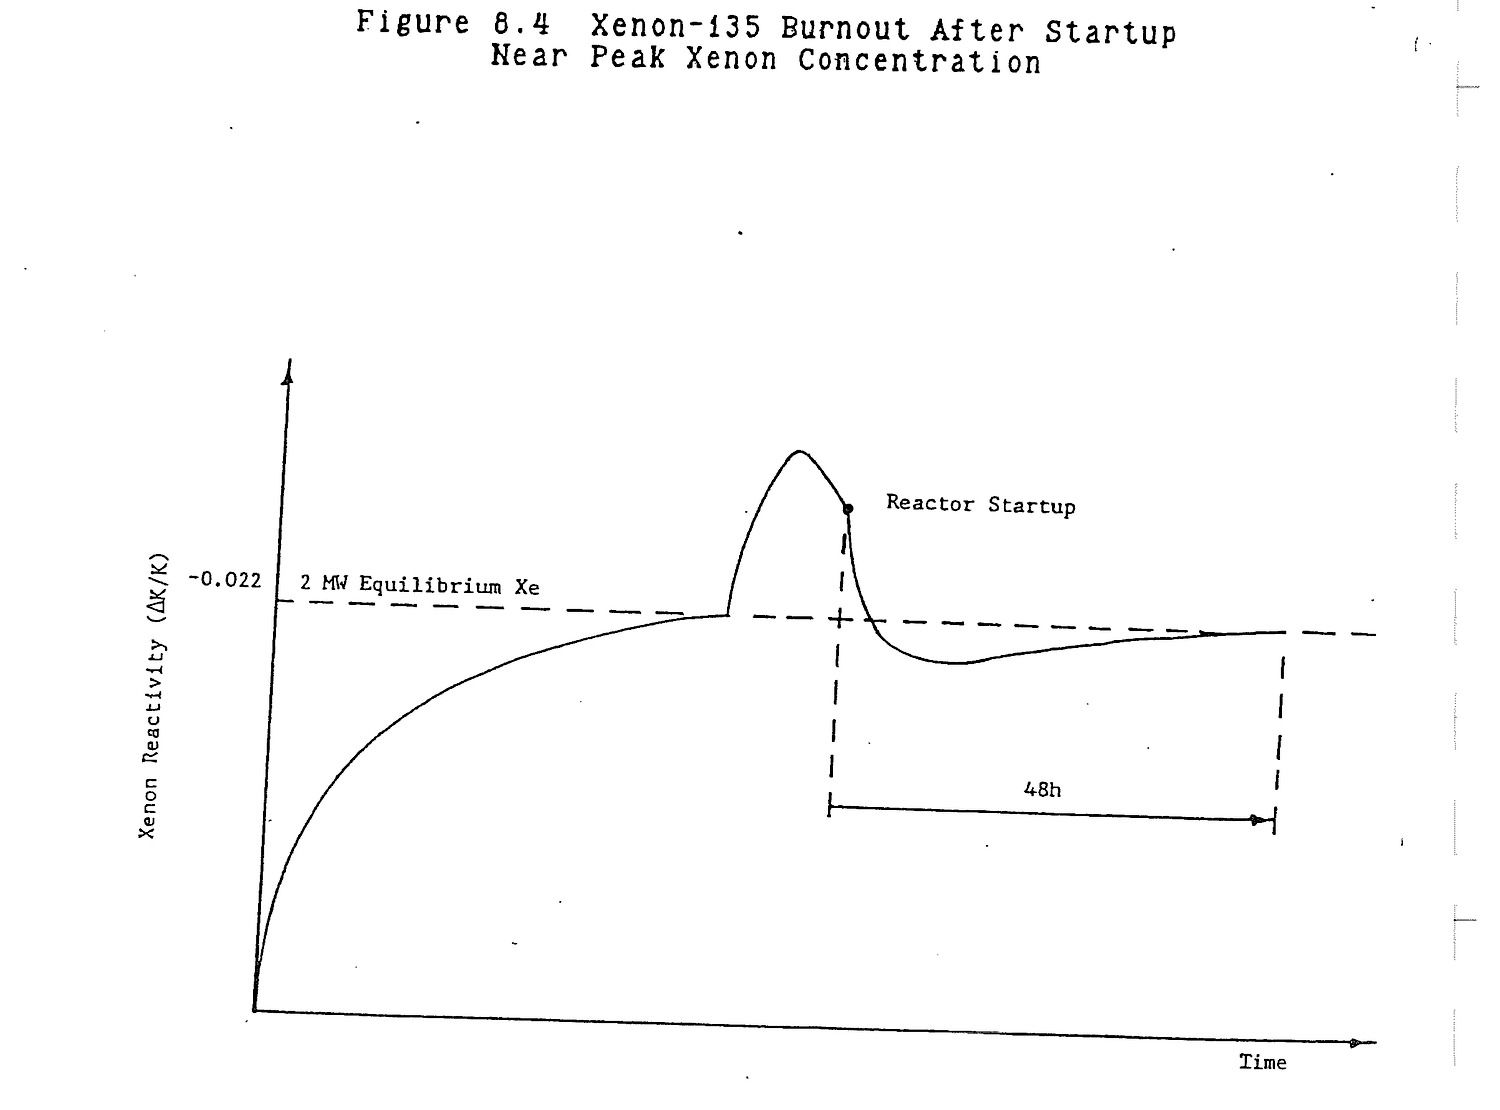
results in fissions which produce iodine and xenon. Eventually, this production balances the decay and burnout and equilibrium xenon is reestablished. If power level were different from the preshutdown level, a different equilibrium level would be established. The dominant half-life is still iodine's 6.7 hr. Equilibrium will be reestablished after approximately 48 hours.
How does xenon respond during a reactor startup following a shutdown?
A rapid increase in flux causes xenon to deplete by burnout. Eventually a new equilibrium balance is established that corresponds to power.
Power transients can be treated as miniature startups and shutdowns. As shown in Figure 8.5, an increase in power, like a startup, causes a dip in xenon concentration due to burnout and a gradual increase up to a higher concentration due to increased iodine and direct xenon production by fission. A power decrease causes a xenon peak due to the excess iodine present and reduced burnout. For a power increase, true equilibrium is reestablished after 48 hours; for a power decrease after approximately 72 hours. However, practical equilibrium can be reestablished in a much shorter time if the change in power is very small. Exact time values are difficult to pinpoint.
Generally describe the effects of power transients on xenon concentration.
An up power maneuver is analogous to a miniature startup and produces a xenon dip before the new higher equilibrium is established.
A down power maneuver is analogous to a miniature shutdown and produces a small xenon peak before the new lower equilibrium is established.
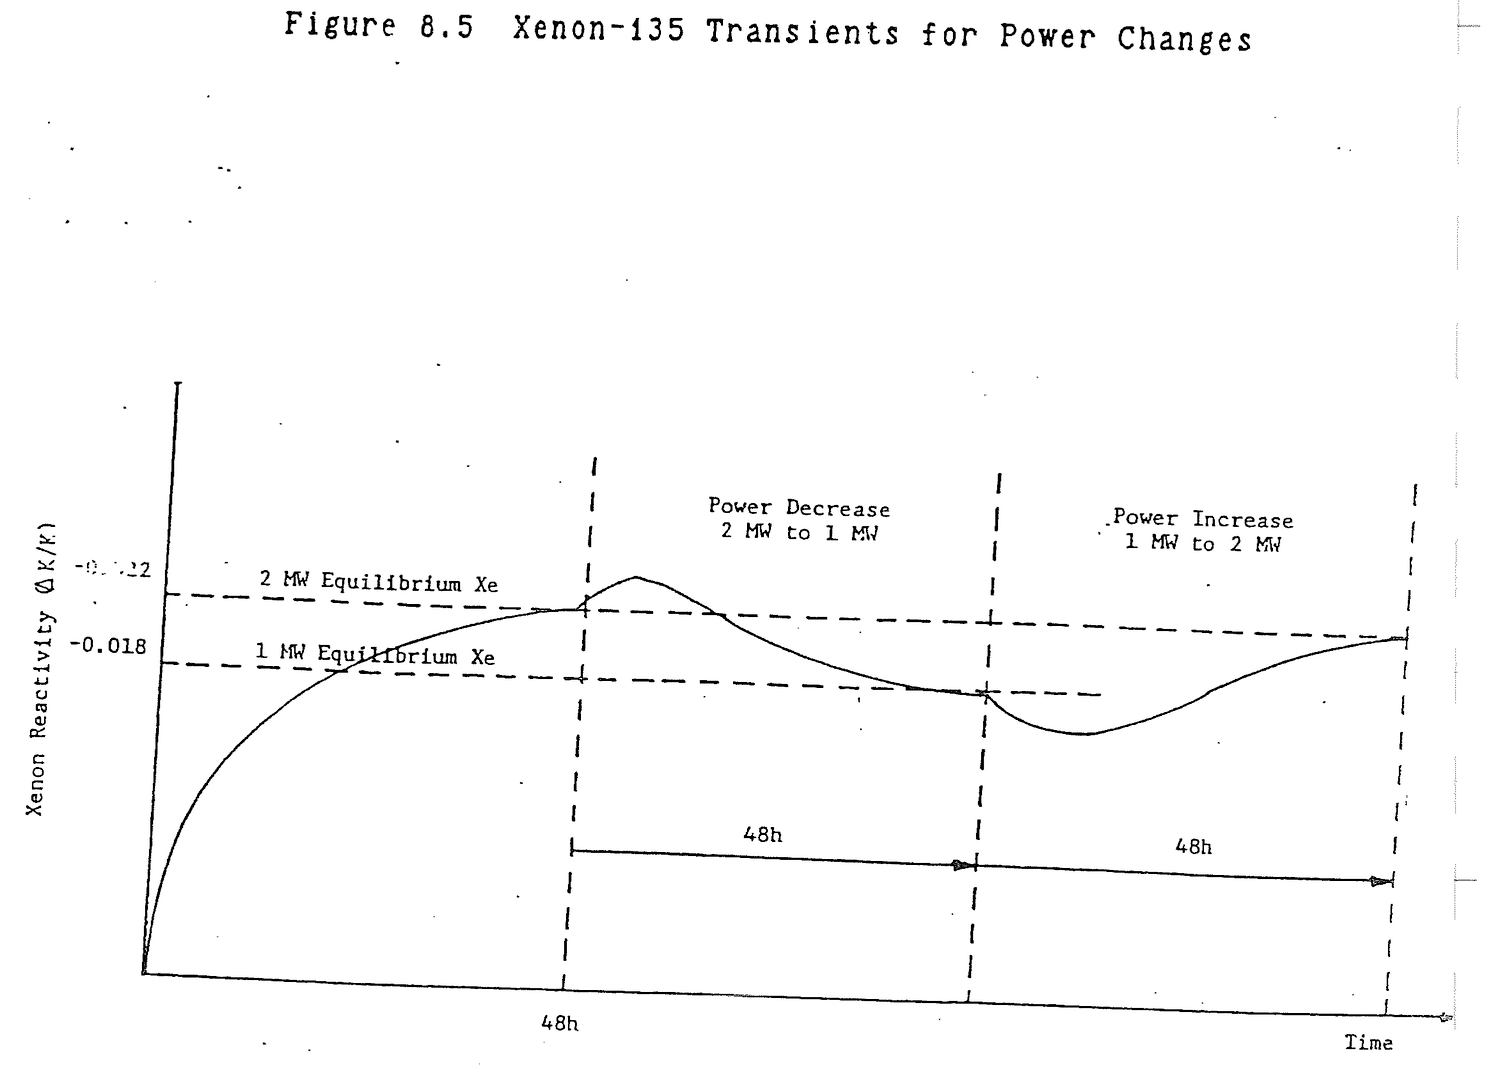
Samarium-149 is produced by radioactive decay of promethium-149. Samarium-149 is not a fission product. Samarium-149 is stable, but it is depleted by burnout. Promethium-149 is not a fission product, but results from the decay of neodymium-149 which is. Because the half-life of neodymium-149 is short in comparison to that of promethium-149, the two are treated as if promethium-149 were formed directly from fission. The fission yield for Pm149, gp, given in Table 8.2 is, in fact, the Nd149 fission yield.
Describe the samarium balance in a reactor.
Figure 8.6
Sm149 is formed by Pm149 decay. Sm149 is lost by neutron absorption. Pm149 is formed by fission. Pm149 is lost by decay to Sm149.
The time rates of change of samarium and promethium can be determined from Figure 8.6.
dS/dt = λpP - Sσsφ (8.9) dP/dt = γpΣfφ - λpP (8.10)
where:
S = Samarium number density, atoms/cm3 P = Promethium number density, atoms/cm3
Both samarium and promethium would be expected to start at zero levels in the reactor and build up exponentially to equilibrium values. The 54.1 hour Pm149 half-life is the controlling time constant. After seven Pm149 half-lives or approximately 16 days, promethium and samarium will have reached equilibrium. The equilibrium values of samarium and promethium are obtained from equations (8.9) and (8.10).
P = γpΣfφ/λp (8.11) S = γpΣf/σs (8.12)
The surprising result is that equilibrium samarium is independent of neutron flux. Equilibrium samarium reactivity is approximately -0.006 ΔK/K.

Derive the equation for equilibrium samarium.
dS/dt = λpP-Sσsφ = 0 dP/dt = γpΣfφ - λpP = 0 0 = γpΣfφ - Sσsφ S = γpΣfφ/σsφ = γpΣf/σs
Is equilibrium samarium flux dependent?
No, equilibrium samarium has a fixed value for any power level in a given reactor. It will vary with fuel loading since Σf contains fuel atom number density.
At shutdown, equations (8.9) and (8.10) become:
dS/dt = λpP (8.13) dP/dt = -λpP (8.14)
Promethium undergoes simple decay after shutdown.
P(t) = Pe-λPt (8.15)
Sutstitute (8.15) in (8.13) and solve for S(t).
S(t) = S+P(1-e-λPt) (8.16)
Equation (8.16) says that at shutdown, when t is zero, S(t) = S, and after a long period of time, 7T2 Pm149 = 16 days, S(t) = S+P, that is, all of the promethium that was in the core has decayed to samarium. Since promethium concentration is flux dependent, the shutdown samarium concentration and reactivity will increase with increased power as shown in Figure 8.7.
The amount of samarium reactivity following shutdown is, from a practical point of view, negligible for two reasons. First, end of cycle shutdowns are four days. Since seven promethium half-lives are 16 days, only a small amount of
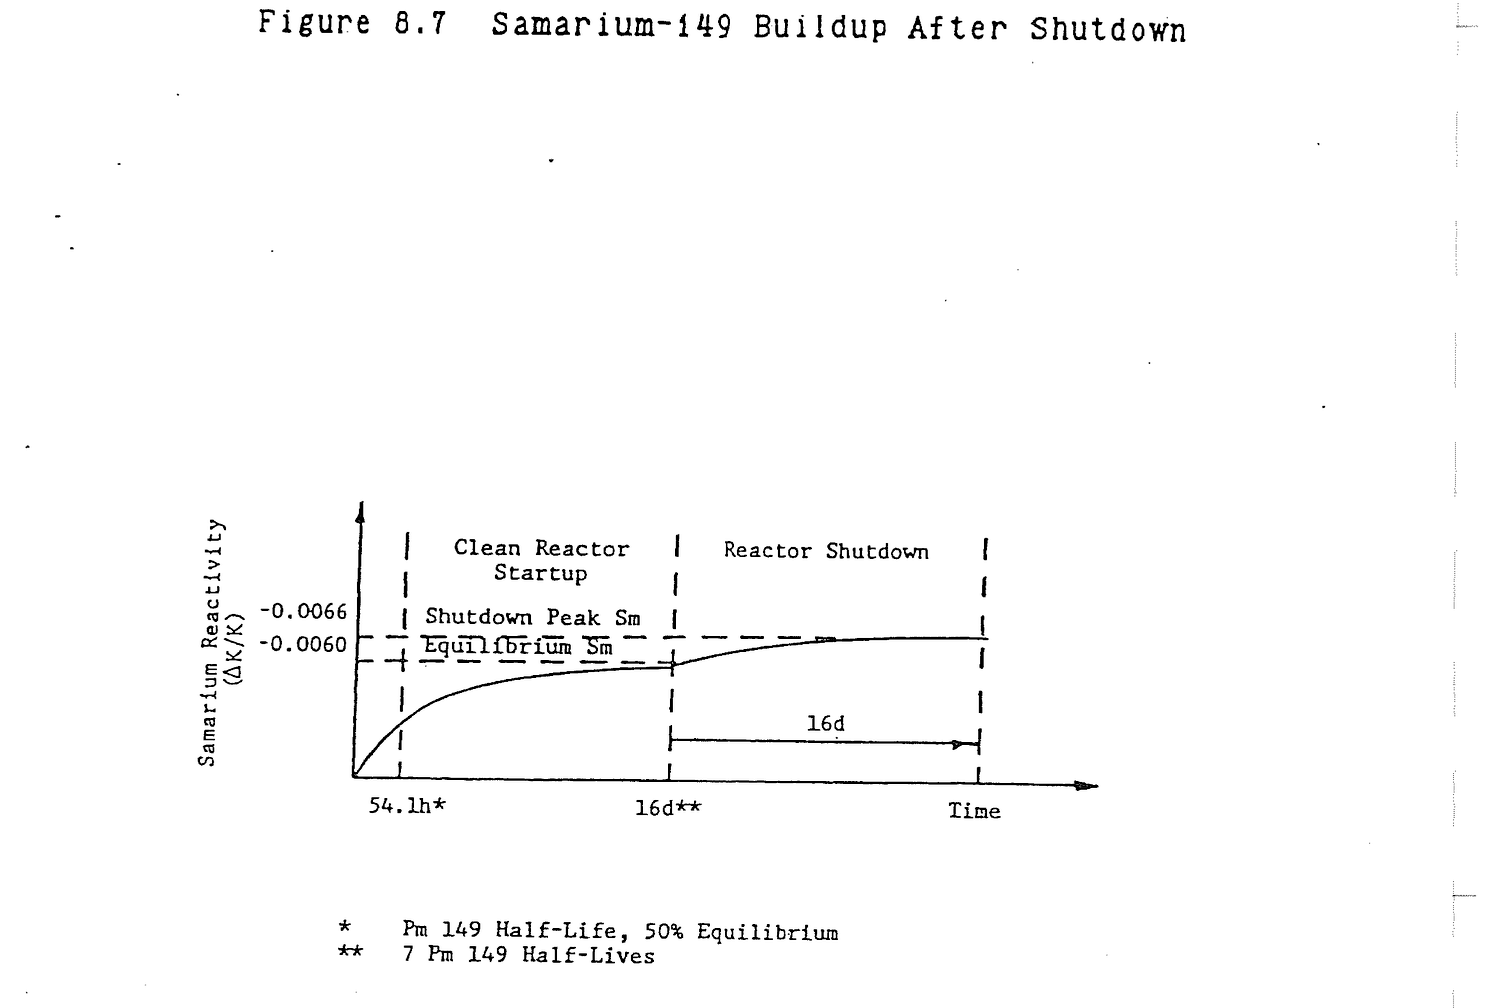
promethium decays to samarium prior to the next startup. Second, peak samarium reactivity as the result of promethium decay is approximately one-tenth of equilibrium samarium reactivity or about -0.0006 ΔK/K.
What happens to samarium following a reactor shutdown?
All of the promethium in the core decays to samarium and, since samarium is stable, the samarium builds up to a shutdown level and stays at that level. The level of samarium buildup depends on operating power because promethium is power dependent.
If the reactor is started up following shutdown, promethium is depleted so samarium production from promethium decay is reduced. However, samarium burnout is maximum because of restoration of full flux at power and higher than equilibrium samarium concentrations. Samarium decreases rapidly until promethium formation by fission reestablishes samarium production to restore the equilibrium balance. Samarium burnout is illustrated in Figure 8.8. Once again, the time to reach equilibrium is about 16 days.
How does samarium respond during a reactor startup following a shutdown?
Restoring flux causes samarium to burnout and eventually become restored to the equilibrium level. The rate at which burnout occurs depends upon power level.
If power is increased, samarium concentration will decrease initially due to higher burnout. Eventually samarium production will increase to bring samarium concentration back up to its equilibrium value. If power is decreased, burnout decreases while production by promethium decay remains constant. Samarium concentration increases. Eventually the concentration of promethium reduces because it decays and because it is being produced by a lower flux. Samarium concentration returns to its equilibrium value. In both cases, the transient time is approximately 16 days. Samarium transients as the result of an increase and a decrease in power are illustrated in Figure 8.9.
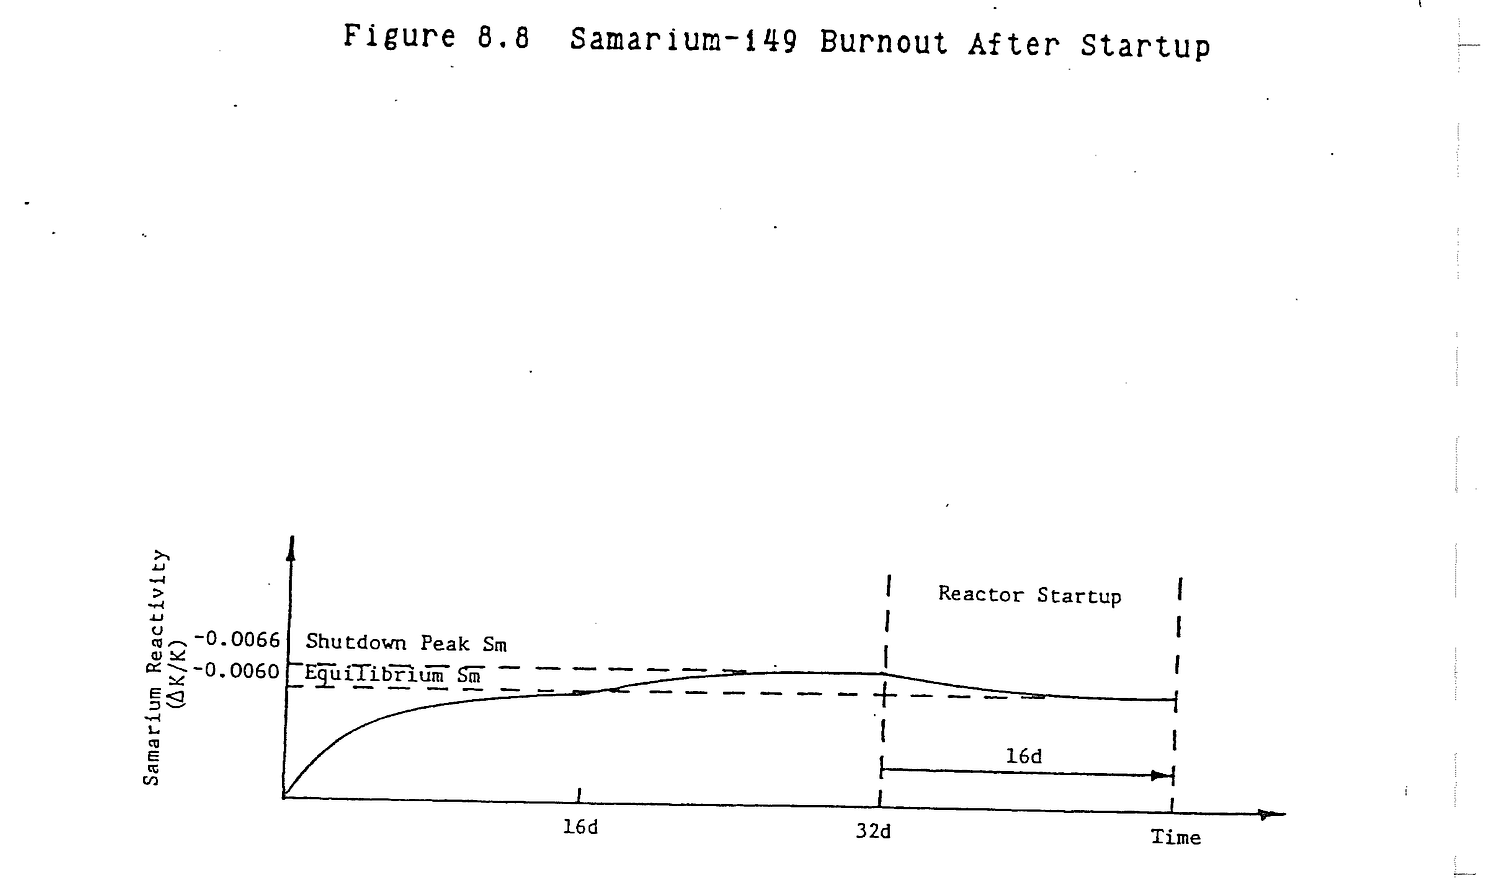

Generally describe the effects of power transients on samarium concentration.
An up power maneuver causes a dip in samarium due to burnout with an eventual restoration to equilibrium. A down power transient causes a temporary buildup of samarium due to Pm149 decay with an eventual restoration of equilibrium.
8.8.1 Explain how xenon is formed in the reactor, how it is eliminated, and what effect it has on operations of the reactor.
Solution:
Xe135 is a fission product and is also produced from the decay of I135. It is eliminated through decay and neutron absorption (burnout).
Xenon 135 has the highest isotope thermal neutron absorption cross section and therefore excess reactivity must be available to maintain a reactor at criticality as xenon is formed.
8.8.2 (a) How is samarium introduced into the reactor system?
(b) How is it removed?
Solution:
(a) Samarium-149 is produced by the radioactive beta decay of promethium-149.
(b) Samarium-149 is removed by neutron absorption to form samarium-150 which has a small cross section.
8.8.3 (a) How long does it take to reach xenon equilibrium?
(b) How long does it take to reach samarium equilibrium?
(c) What are the half-lives of xenon and samarium after shutdown?
(d) How long after shutdown are peak xenon and samarium levels reached?
Solution:
(a) Xenon reaches equilibrium about 48 hours or 2 days after operating at a constant neutron level.
(b) Samarium increases slowly over a period of 16 days to its equilibrium value.
(c) Xenon half-life is 9.2 hrs. Samarium will not decay, it will only absorb a neutron and become Sm150. Sm149 is stable.
(d) Peak xenon is reached 7-10 hours after shutdown. Samarium does not peak but increases slowly to a shutdown value as promethium-149 decays. The shutdown level is reached about 16 days after shutdown.
8.8.4 (a) Why does Xe concentration peak after reactor shutdown?
(b) What happens when it passes its peak?
Solution:
(a) Built up iodine-135 decays to xenon-135. Iodine has a shorter half life than xenon and the equilibrium inventories of each at power are such that initially more iodine decays to xenon than xenon decays to cesium-135.
(b) The iodine inventory has diminished so that more xenon is decaying to cesium than iodine is decaying to xenon. Xenon continues to decay until its level is essentially zero.
8.8.5 Sketch reactivity versus time for both xenon-135 and samarium-149 with the following power history:
(a) Clean core startup to 100% power;
(b) 100% power for four days;
(c) Shutdown for 15 hours;
(d) Startup to 50% power;
(e) 50% power for 30 days;
(f.) 100% power for 4 days.
8.8.6 Explain why, or why not, each of the following is dependent on neutron flux.
(a) Power level
(b) Xenon equilibrium
(c) Samarium equilibrium
Solution:
(a) Power level is flux dependent.
Power = NfσfφV Nf = atom U235/cm3; σf = U235 microscopic cross section, cm2; V = Core volume, cm3; φ = Average flux, n/cm2/sec.
(b) Equilibrium xenon is flux dependent.
dI/dt = γINfσf - λII = 0 dX/dt = γXNfσfφ - λXX + λII - XσXφ = 0 Solve for X: X = (γX + γI)Nσfφ/(λX + σXφ)
(c) Equilibrium samarium is independent of flux.
dP/dt = γPNfσfφ - λPP = 0 dS/dt = γPP - SσSφ = 0 Solve for S: S = γPNfσf/σS
8.8.7 Explain major operational differences between xenon and samarium.
8.8.8 State what percent of all fissions result in xenon.
8.8.9 Explain the difference in xenon concentration at 50% power equilibrium and at 100%.
8.8.10 Xenon poisoning:
(a) Can cause positive reactivity transients;
(b) Can cause negative reactivity transients;
(c) Is a fission product;
(d) Is a result of β-decay;
(e) (b) and (d);
(f) All of the above;
(g) Has nauseous odor.
8.8.11 The reactor is operating at 80% power and then power is decreased to 60%. Explain the following:
(a) Change in xenon concentration for next 12 hours.
(b) Rod movement required to maintain 60% power.
8.8.12 Sketch the xenon curve for the following:
(a) Startup and operation at 50% power for 20 hours;
(b) Increase to 100% power for 40 hours;
(c) Scram after the 40 hour run.
8.8.13 Samarium-149 and xenon-135 are both reactor poisons.
(a) Write the nuclide equation for each starting with the major fission product.
(b) Explain why the reactivity effect of xenon-135 is more of a problem to reactor operation than the effect of samarium-149.
8.8.14 Describe the rod motion which would be required near the beginning of core life following the below changes. Include the approximate times until equilibrium conditions would be established. Consider xenon effects only.
(a) Cold, clean startup to full reactor power;
(b) Increase in power from equilibrium conditions at 30% to 90% power;
(c) Reduction from full power to 20% power;
(d) Return to full power operation 4 hours after a scram from 100% power.
This page of the original is blank apart from its running header and page label.
Core analysis includes determination of reactor core neutron flux profiles, determination of the conditions for reactor criticality, the effects of fuel burnup and fission product poisons on core flux, and core temperature profiles based upon heat generation rate, coolant flow rate, and core inlet temperature.
After studying the lesson material and working exercise problems, the student should be able to:
1. Describe core thermal and fast neutron flux profiles.
2. Describe shifts in flux profiles with rod motion, fuel burnup, and fission product poison buildup.
3. Describe typical core temperature profiles and the basis for their shapes.
Neutron balance in a reactor core weighs neutron production by fission against losses by absorption and leakage. The time rate of change of flux is:
dφ/dt = Fission Production-Absorption-Leakage
= νΣfφ - Σaφ - Leakage Divergence (9.1)
The first two terms are fission and absorption reaction rates. Leakage divergence is somewhat more complex mathematically, though simple conceptually. Neutrons will tend to move from a location of high flux (core center) to a position of lower flux (core edge). This motion, called divergence, accounts for the fact that neutron leakage occurs, particularly in small cores.
Divergence is represented as the second derivative of flux with respect to distance. This is analogous to acceleration being the second derivative of distance with respect to time.
S = Distance v = Velocity = Time rate of change of distance = change in distance/change in time = (S2-S1)/(t2-t1) = ds/dt a = acceleration = Time rate of change of velocity = change in velocity/change in time = (v2-v1)/(t2-t1) = dv/dt = d/dt(dS/dt) = d2S/dt2
If distance is being travelled at a constant rate, velocity is constant. The time rate of change of velocity is zero and there is no acceleration. Thus, the second derivative is zero unless the first derivative is changing with time.
Divergence represents flux changing with respect to distance or position. In Figure 9.1.a, flux is constant. dφ/dx is zero.
In Figure 9.1.b, flux changes across the core at a constant rate. dφ/dx which is the slope, m, of flux versus position in the core is constant. In this case, the second derivative representing the change in the slope of flux across the core is zero. In Figure 9.1.c, the flux slope varies continuously across the core. The divergence, dm/dx = d2φ/dx2, has a value which is not zero and, when multiplied by a diffusion constant, -D, represents the leakage of neutrons from the core. The reason for assigning a minus to D is not obvious, but essentially results from the fact that flux decreases as x moves in the positive direction.
dφ/dt = νΣfφ - Σaφ + Dd2φ/dx2 (9.2)
The steady state core flux can be determined by setting dφ/dt = 0. Bring the divergence to the left side of the equation (9.2) and divide through by D.
d2φ/dx2 = (Σaφ-νΣfφ)/D
= ((Σa-νΣf)/D)φ (9.3)
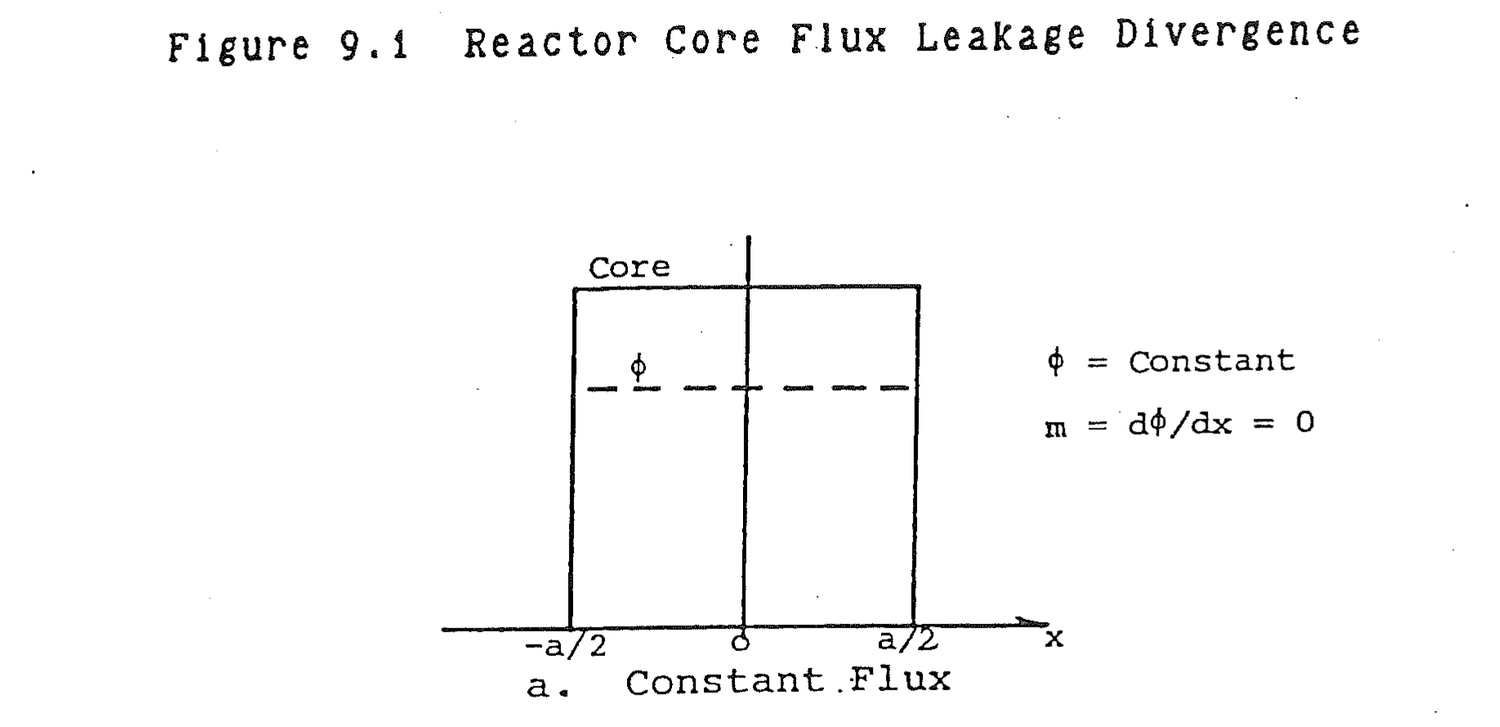
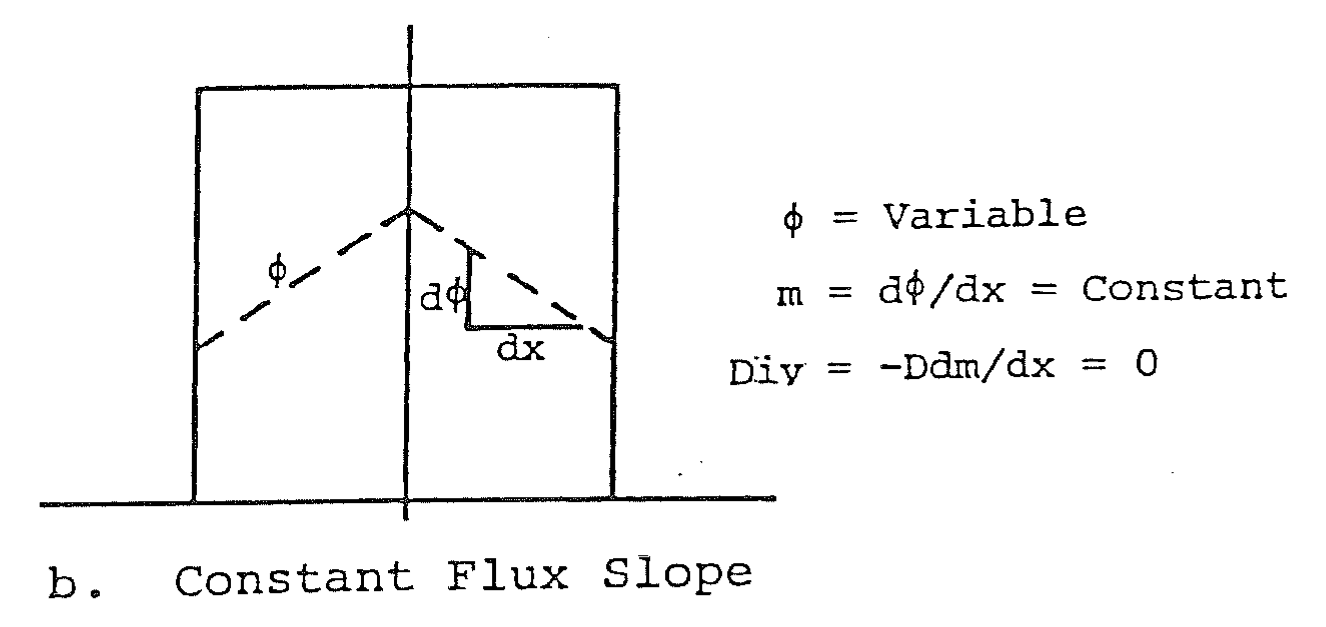
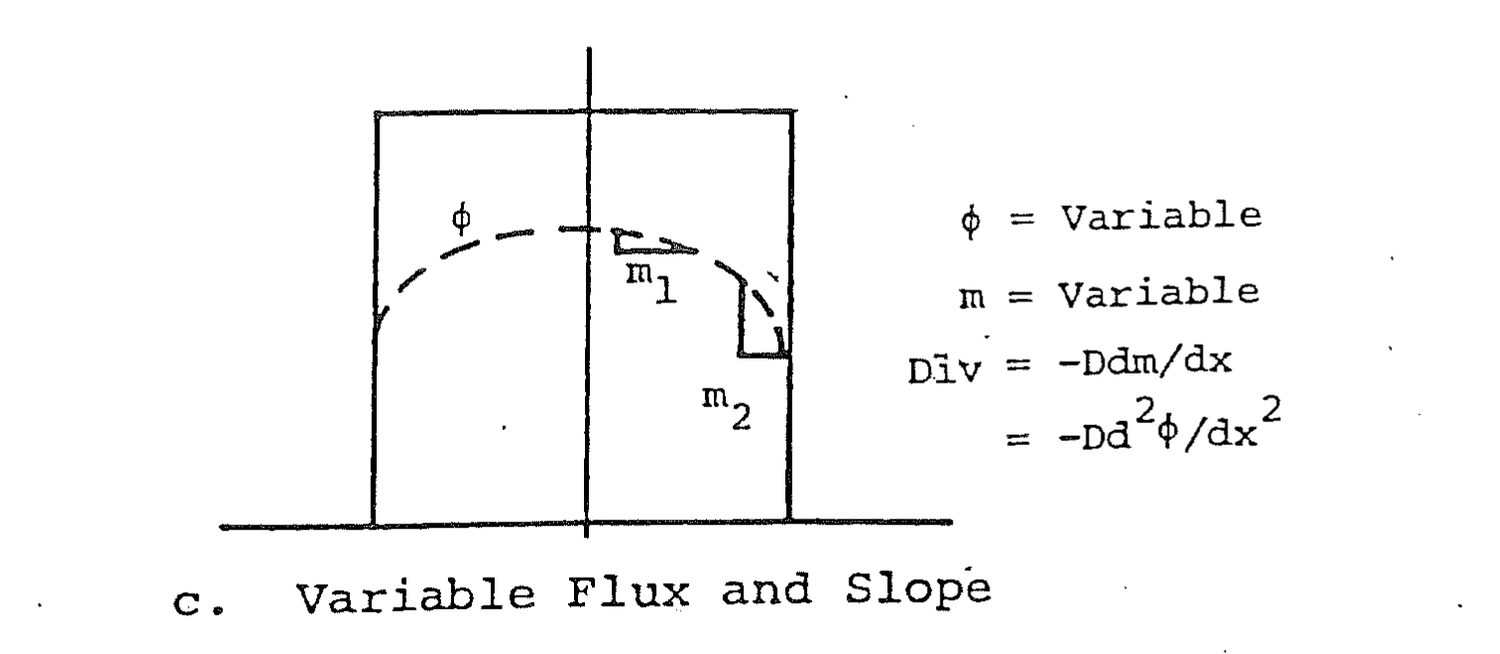
The solution to equation (9.3) depends upon the relative magnitude of νΣf and Σa. If Σa is greater than νΣf, the core will tend to absorb more neutrons than are produced by fission. In many ways, the core will appear to be a shield that attenuates neutrons passing through. The solution to equation (9.3) is a negative exponential.
φ(x) = φ0e-√((Σa-νΣf)/D)x (9.4)
The resultant flux profile appears in Figure 9.2.a. If νΣf is greater than Σa, fission production exceeds absorption losses. The resultant flux profile in Figure 9.2.b is the characteristic cosine shape which is, in reality, a combination of exponentials.
φ(x) = φ0 cos(π/a)x (9.5)
where a is the width of the core.
Reactor core analysis generally divides core neutrons into two groups; thermal (0-0.625eV) and fast (0.625eV-10MeV). Figure 9.3 provides fast and thermal flux profiles for a core with an adjacent reflector. Within the core νΣf>Σa so the fast flux has a cosine shape. In the reflector, νΣf is zero so the flux decreases exponentially away from the core. The thermal flux is produced by scattering down of fast neutrons. The source of thermal neutrons becomes Σsφ, the scattering reaction rate of fast neutrons. In equation (9.3), Σs replaces νΣf for thermal neutron flux calculations. In the core, Σs>Σa producing the cosine flux shape in Figure 9.3. In the reflector, which is water, Σs>Σa again so the thermal flux there also has a cosine shape. Physically, fast neutrons being attenuated in the reflector are not all lost. Most of them convert to thermal neutrons.
What are the sources and losses of thermal and fast neutrons in a reactor?
Source Losses
Fast Neutrons Thermal Fission Scattering to
Fast Fission. Thermal
Neutron Source Absorption
Fission Product Decay Leakage
Thermal Neutrons Fast Scattering Absorption
Leakage
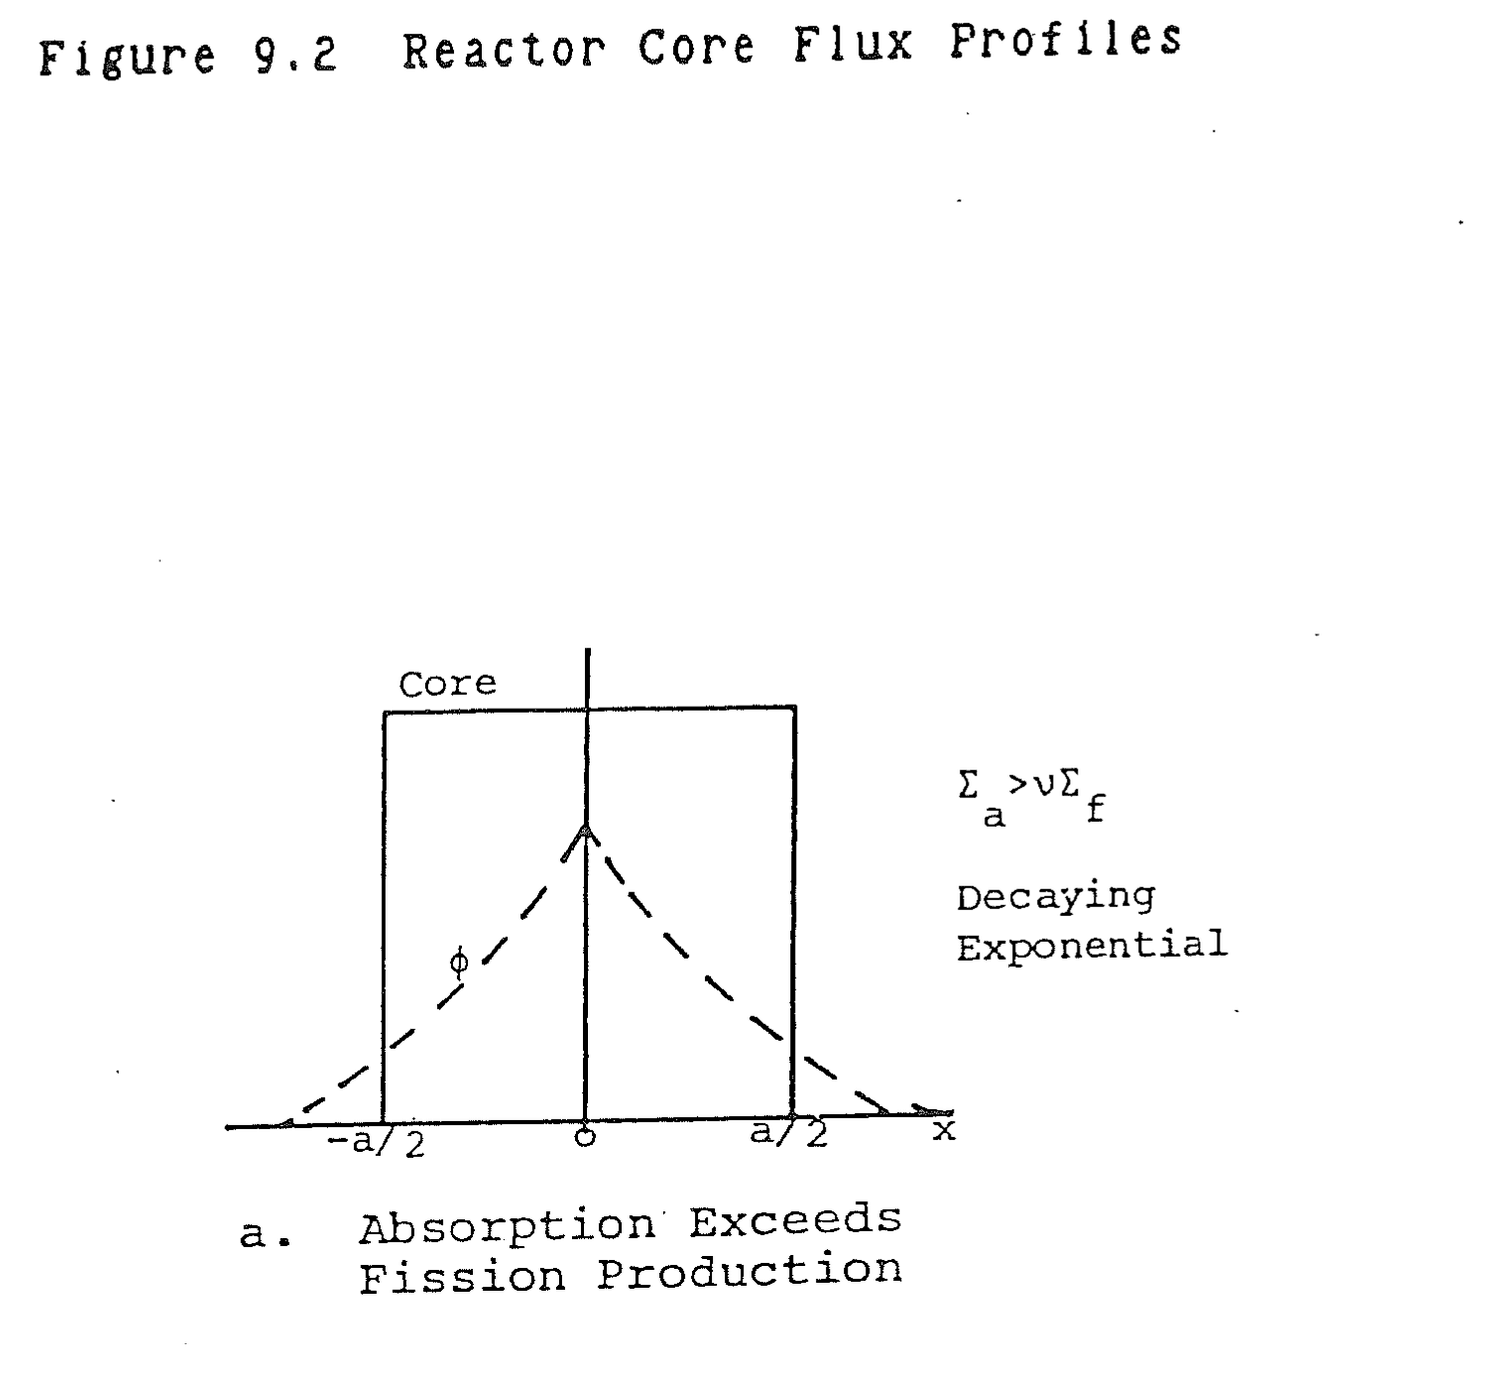
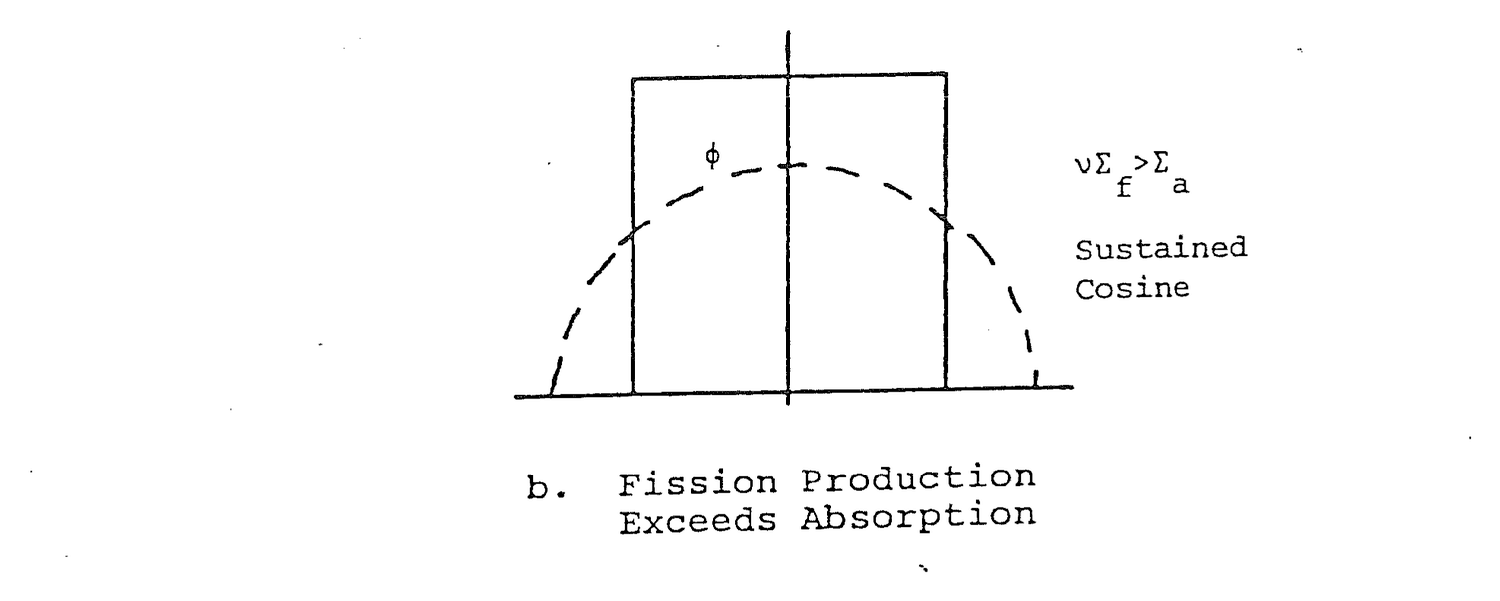
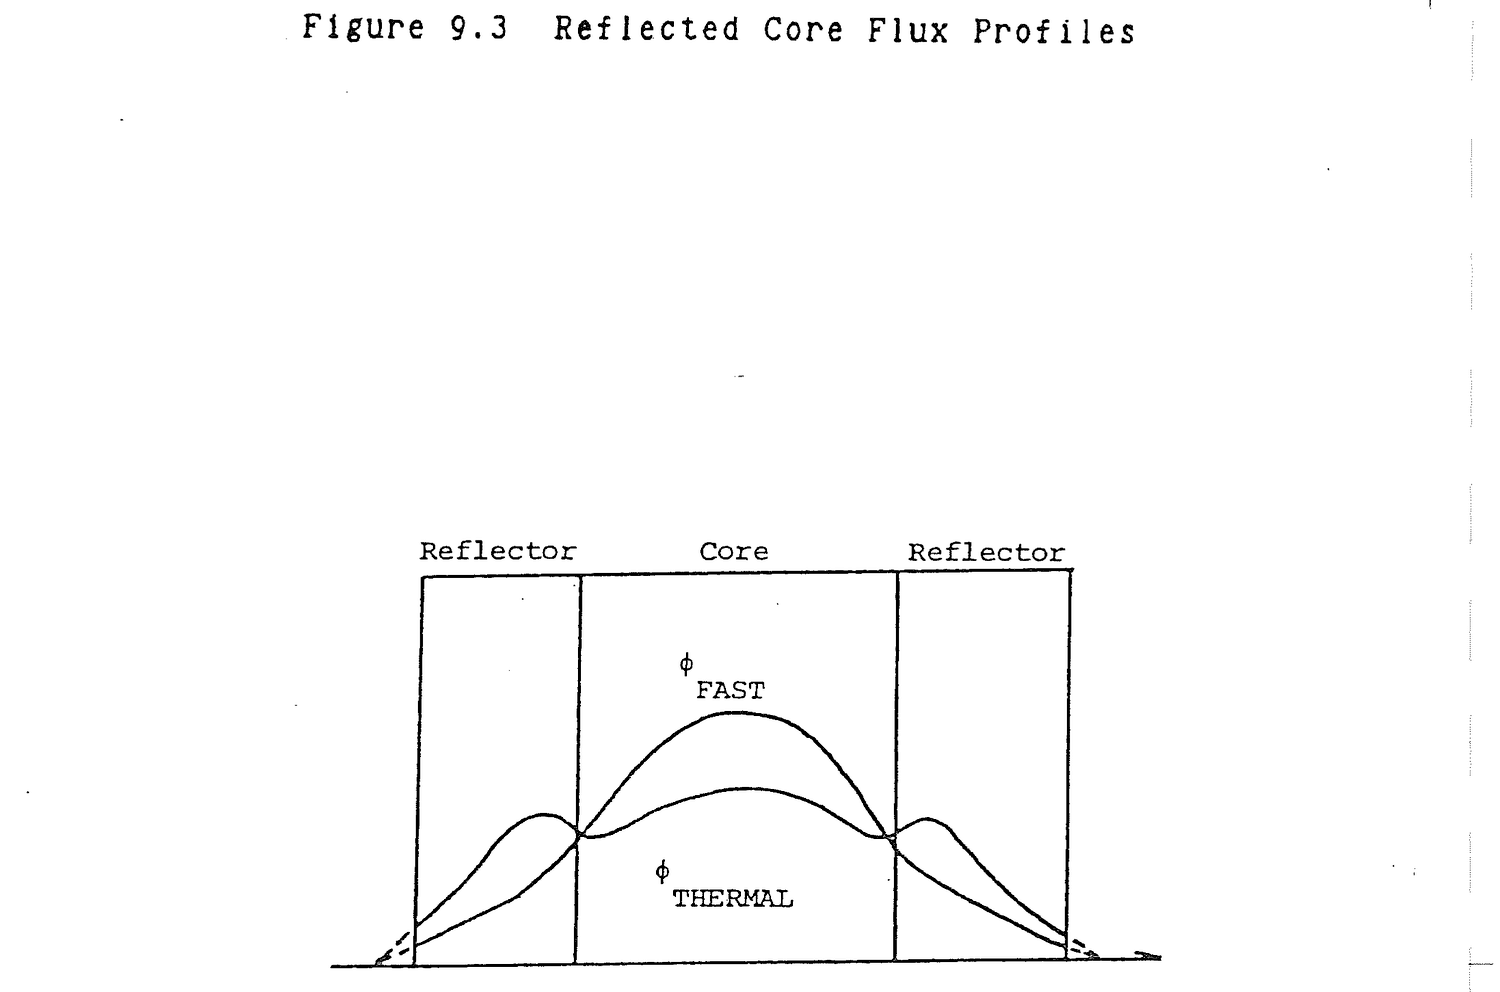
In general, why are the axial and radial fluxes in a reactor cosine shaped?
If a reactor had uniformly loaded fuel and absorbers, core flux would be uniform. Leakage produces the cosine shape. Neutrons diffuse from high concentrations in the core to low concentrations external to the core. This diffusion occurs from the center toward the edges of the core and produces an approximate cosine shape.
Thermal neutron flux tends to peak in the water reflector surrounding a reactor core. What is the source of these neutrons?
Fast leakage neutrons that thermalize in the reflector.
In equation (9.3), the characteristics of the core materials that determine flux shape and reactor criticality are called material buckling, Bm. From equation (9.3);
Bm2 = (Σa-νΣf)/D (9.6)
From equation (9.5), the geometric characteristics of the core are called geometric buckling, Bg.
Bg2 = (π/a)2 (9.7)
In a critical reactor, the geometric buckling and the material buckling must be equal.
Bg2 = Bm2 (π/a)2 = (Σa-νΣf)/D (9.8)
Each of the material parameters is a constant or can be calculated from information about core construction such as fuel and absorber number densities. Once these values are known, the core diameter, a, can be calculated using equation (9.8). Reactor core design involves an iteration of setting and resetting core geometry and materials until a satisfactorily sized critical core is obtained.
From an analytical perspective, how is reactor criticality determined?
Geometric buckling is set equal to material buckling.
(π/a)2 = (Σa-νΣf)/D
where:
a = Core diameter; D = Diffusion constant.
Reactor core axial and radial flux profiles can be described as clipped cosines as shown in Figure 9.4 and mathematically described in equation (9.5). The flux does not go to zero at the core boundary but at some location external to the core called the extrapolated boundary. Within the core, the ends of the cosine curve are clipped so that flux level at the edge of the core is about half peak flux. The integrated thermal flux over the energy range 0-.625 eV is less than the integrated fast flux over the range .625 eV-10 MeV. Thus, in Figure 9.4, fast flux is greater than thermal flux because both are integrated values.
Control rods suppress flux in their vicinity as shown in Figure 9.5. If reactor power is maintained constant, the flux must increase elsewhere in the core to sustain the overall fission reaction rate.
Flux pattern shifts over core life are not easily pinned down, but some generalities can be made. Flux will shift toward the direction of rod motion and away from regions of fuel burnup and xenon buildup. Flux will be suppressed in regions of high fuel burnup and xenon buildup.
Figure 9.6 is an illustration of a core which maintains reactivity by upward rod withdrawal and has no chemical shim. At the beginning of core life, peak flux is below the axial core centerline because of rods in the top of the core. By the end of core life,
Flux shifts upward due to:
a. Rod motion out of the core.
b. Burnup of fuel in the lower region.
c. Xenon buildup in the lower core region.

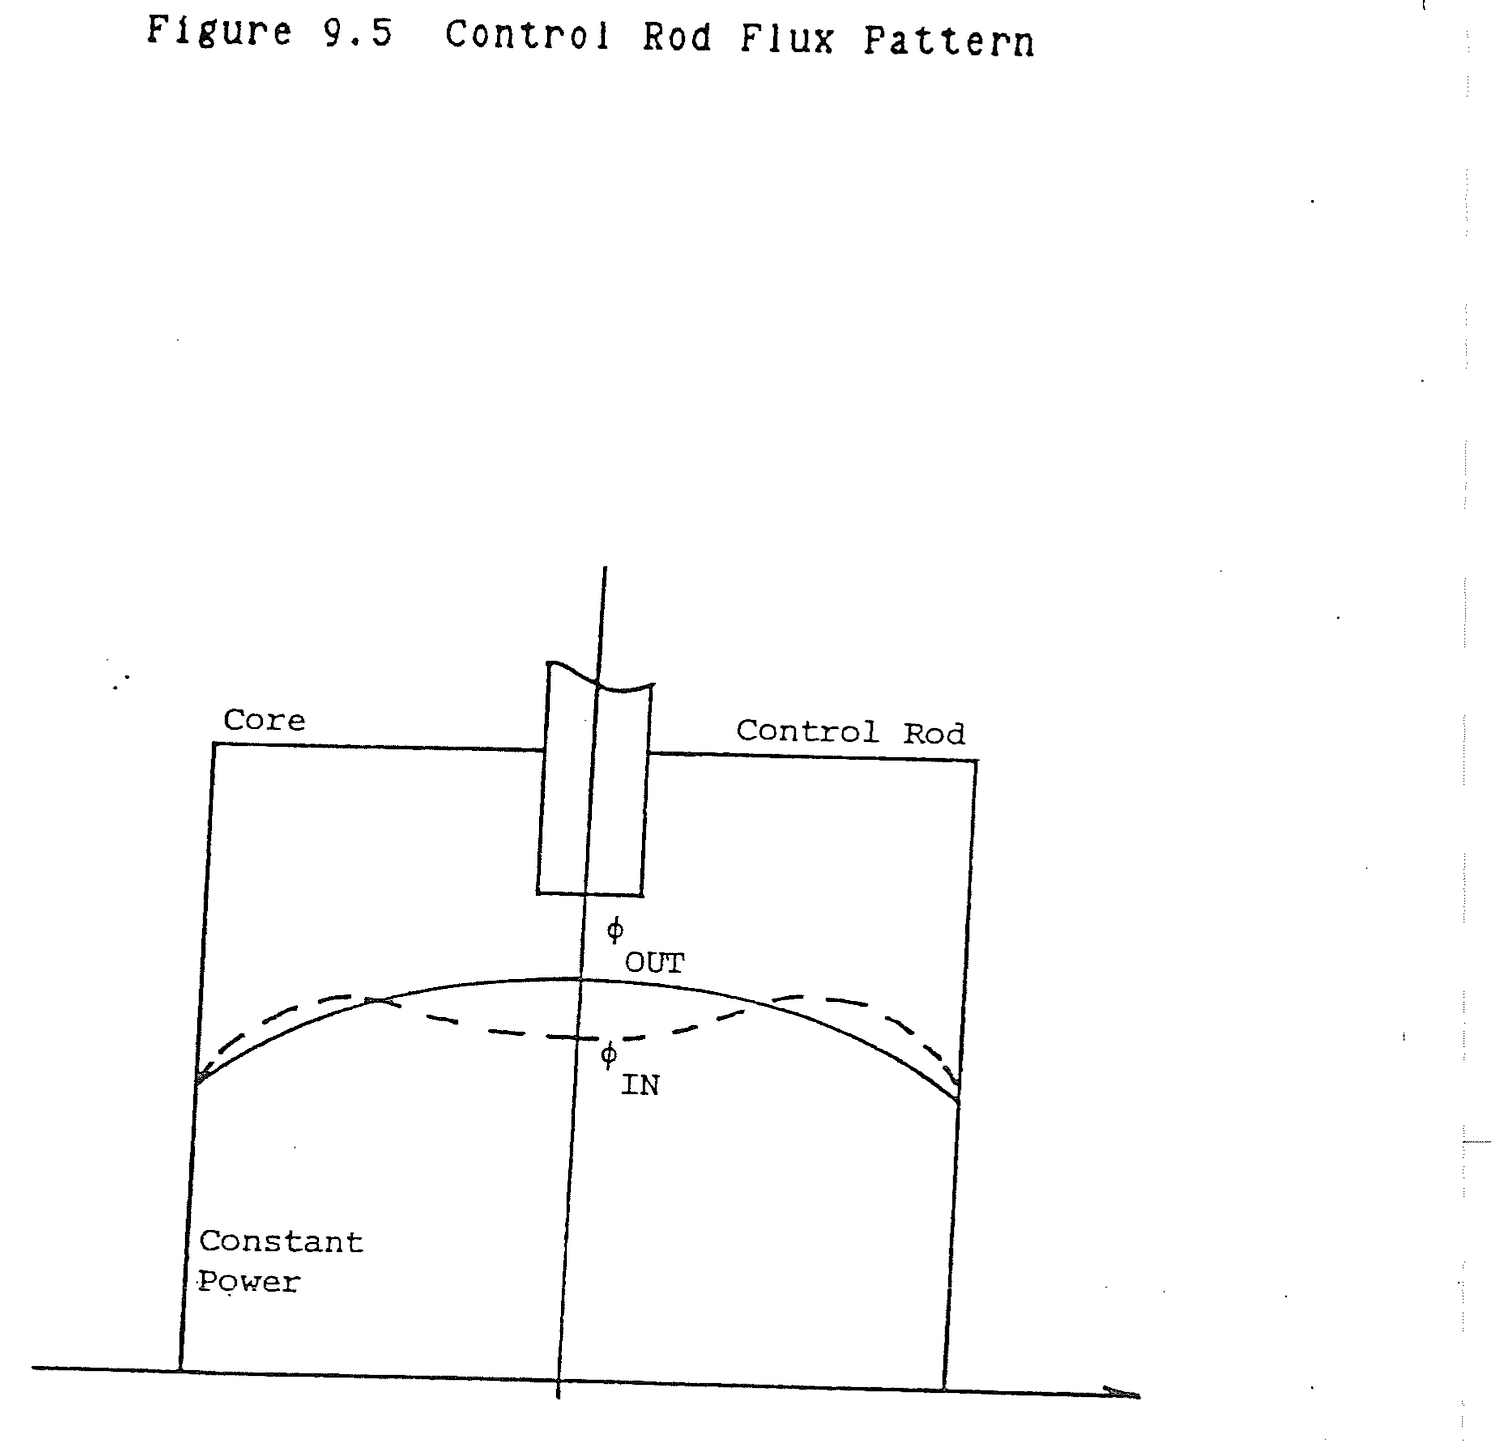

Flux distribution flattens due to:
a. Fuel burnup in the center of the core due to high flux.
b. Xenon peak in the center of the core due to high fission reaction rate.
It is important to remember that if power level is maintained constant, the overall core reaction rate must remain constant. A depression of flux in one core location must be compensated for by a proportional increase somewhere else in the core.
In a power reactor, what is done to flatten flux across the core and reduce leakage?
The most highly enriched fuel is loaded around the outer core perimeter. The core is physically large and reflected to minimize leakage.
Describe how flux patterns shift over core life.
Flux will shift toward the direction of rod motion and away from regions of fuel burnup and xenon buildup. Flux will be suppressed in regions of high fuel burnup and xenon buildup.
As fuel is depleted during reactor operation, the core average flux must be increased to maintain constant power (R = Σfφ). In order to accomplish that, poisons must be removed from the core.
Primary coolant flows downward through the core. Core heat generation rate is maximum near the center of the core at the point of peak flux and fission. It is minimum at the edges of the core where flux is lowest. As water enters the top of the core, it is heated slowly. As it passes toward the core center, the heatup rate increases to maximum. It decreases toward the bottom of the core. The coolant temperature continuously increases as it passes through the core, but the rate at which it is heated varies over the core length. A typical coolant tempeature profile is shown in Figure 9.7. The shape is similar to the shape of an integral rod worth curve for the same basic reasons.
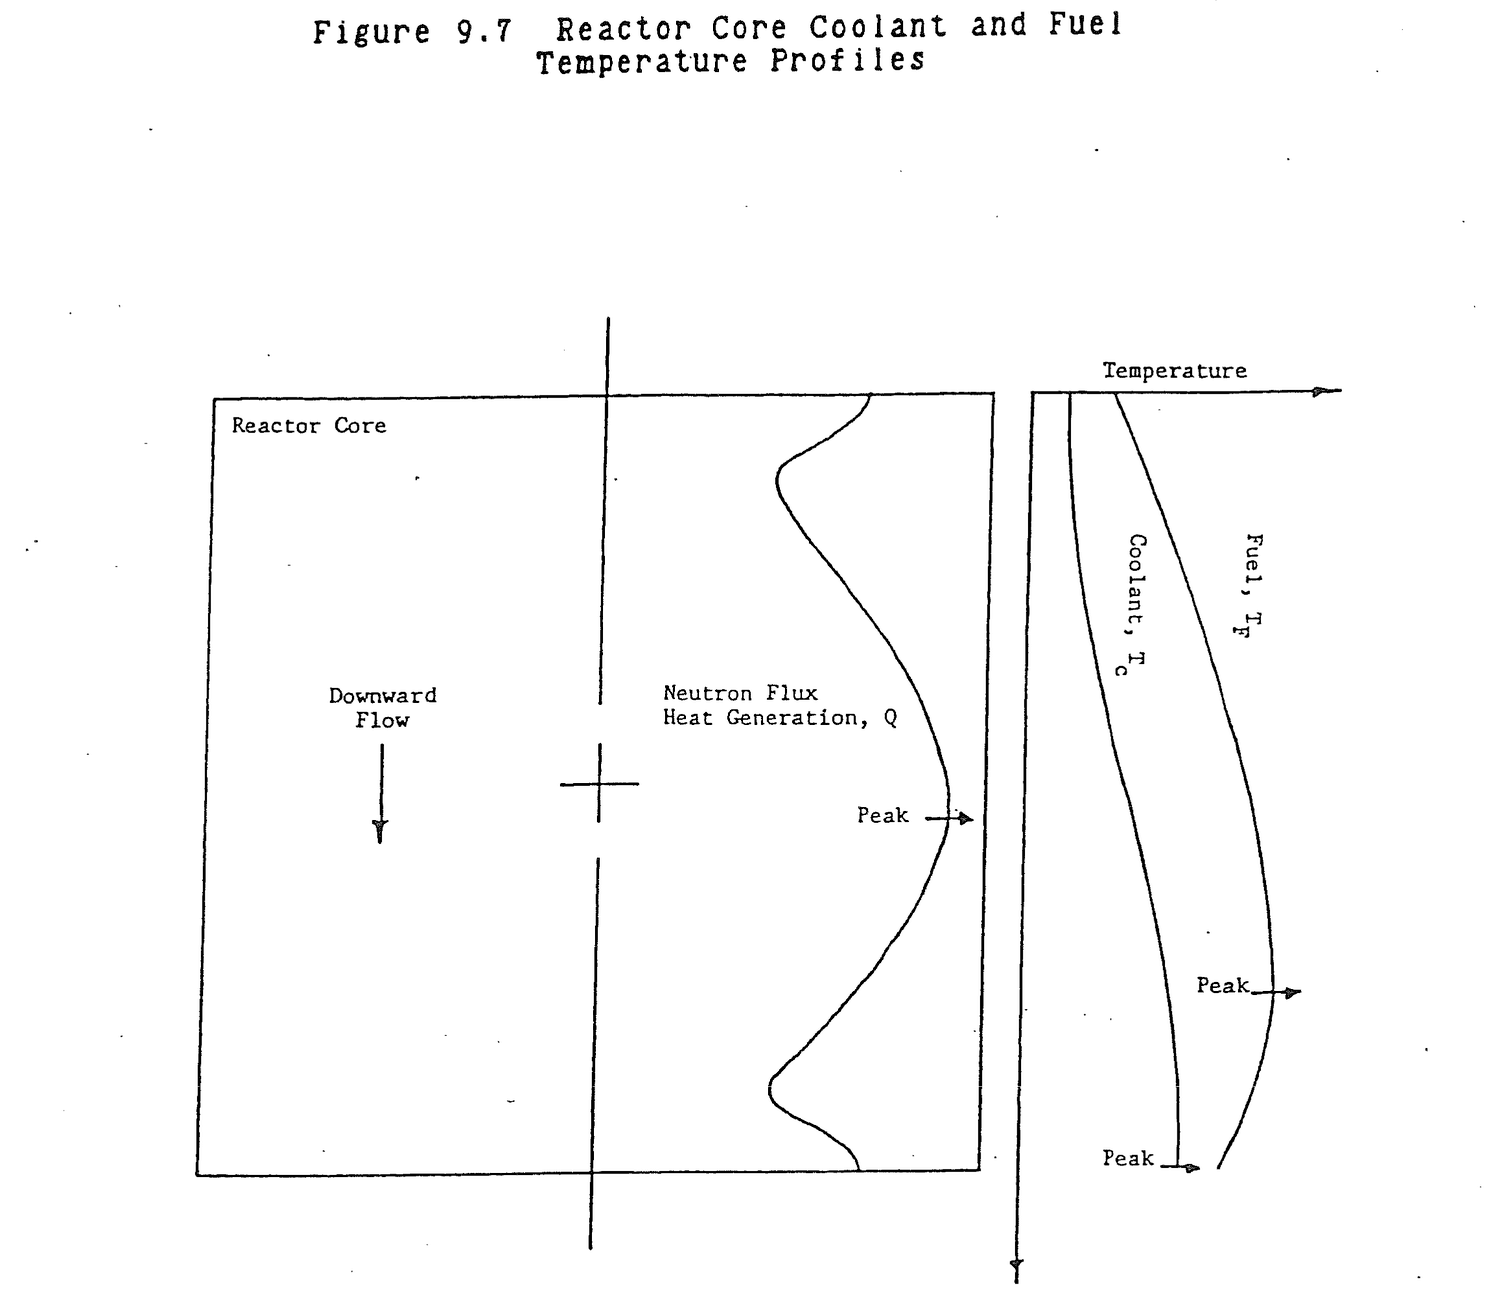
Fuel temperature shape and variation are not determined quite as simply. From heat transfer:
Q = UA(TF-TC) (9.9)
where:
Q = Core heat generation rate, Btu/hr; U = Overall heat transfer coefficient, Btu/hr ft2 F; A = Fuel rod or plate heat transfer surface area, ft2; TF = Fuel temperature, F; TC = Coolant temperature, F.
Solve for fuel temperature.
TF = TC + Q/UA (9.10)
Peak coolant temperatures and peak heat generation do not occur at the same point. Thus, the point of peak fuel temperature will occur at the worst combination of the two; somewhere between the center and bottom of the core for a reactor with vertically downward coolant flow.
Explain where peak fuel temperature is observed in the FNR core and the basis for the peak.
Flux and heat generation, Q, are basically cosine shaped and peak near mid core. Coolant temperature, Tc increases down the core and peaks at the bottom of the core.
Q = UA(TF-Tc)
where:
U = Overall heat transfer coefficient,
Btu/hr ft2 F
A = Rod surface area, ft2
TF = Tc + Q/UA
Peak fuel temperature, TF, occurs at the worst combination of Tc and Q, somewhere between mid core and the bottom of the core.
9.6.1 Define the following and briefly explain their importance:
(a) Radial flux;
(b) Axial flux.
Solution:
(a) Radial flux is a plot of neutron flux vs. some horizontal plane that passes through the center of the core. Radial flux gives information about fuel burn up, that is, which fuel elements are burning most and least fuel. Radial patterns are also helpful in determining rod worth at core positions.
(b) Axial flux is a plot of flux vs. a vertical axis of the core (usually the vertical axis is an individual fuel element). Axial flux gives information about peak flux in a fuel element. This information is used for determining fuel channel hot spots, the effects of rod positioning, burn up, xenon buildup, and heat generation rates.
9.6.2 Briefly describe the neutron balance in a steady state critical reactor.
9.6.3 A hypothetical reactor has no leakage. Fuel and absorbers are uniformly distributed in the core.
(a) Sketch a radial flux profile.
(b) Sketch an axial flux profile.
(c) Briefly explain what effect leakage has on the core radial and axial flux shape.
9.6.4 Sketch fast and thermal flux profiles in an unreflected reactor core.
9.6.5 (a) Sketch fast and thermal flux profiles in a reflected reactor core.
(b) Explain the shapes of the profiles in the reflector.
(c) Fission is the source of fast neutrons in the core. What are the sources of thermal neutrons in the core and in the reflector?
9.6.6 Sketch typical axial thermal flux profiles in the center fuel element at the beginning and end of a cycle. Explain the reasons for the change in the profile.
9.6.7 For a reactor which remains critical at constant power, explain the effects on radial thermal flux profile of inserting a rod in the center of the core and compensating by withdrawing rods at the edges of the core.
9.6.8 For the center fuel element, sketch the following:
(a) Axial flux or heat generation rate;
(b) Axial coolant temperature;
(c) Axial fuel temperature.
Explain the reasons for the shapes of the axial profiles.
This page of the original is blank apart from its running header and page label.
Fundamental Equation Specific Form Auxiliary Relationships
1. A = A0e-λt N = N0e-λt λ = .693/T2
I = I0e-μX μ = .693/X2
= 2.3/X10
2. P = P0et/T
3. T = (l*+(β-ΔK)τ)/ΔK Prompt Critical τ = 1/λ
= (λl*+(β-ρ)/λρ Tpc = l*/ΔK
≈ l*/ρ ρ = K-1/K
≈ K-1
≈ ΔK
K = 1/(1-ρ)
Delayed Critical
Td = (β-ΔK)τ/ΔK ΔK = βτ/(T+τ)
= (β-ρ)/λρ ρ = β/(λT+1)
$ = ρ/β
= (β-ρ)/(λρ+Δρ/Δt)
4. SUR = 26/T
5. Keff = ηεPfLthLf K∞ = ηεPf
= K∞LthLf
6. C = S/1-K
= S/-ρ
7. DR = 6CEn/r2 1Ci Co60 at 1 m = 1 rem/hr
8. (DR1)(r12) = (DR2)(r22) rem = (rad)(Qf)
9. N(atom/cm3) = ρ(g/cm3)A0/M(g/mole) A0 = 6.023x10²³ atom/mole
This page of the original is blank apart from its running header and page label.
Notes:
This page of the original is blank apart from its running header and page label.